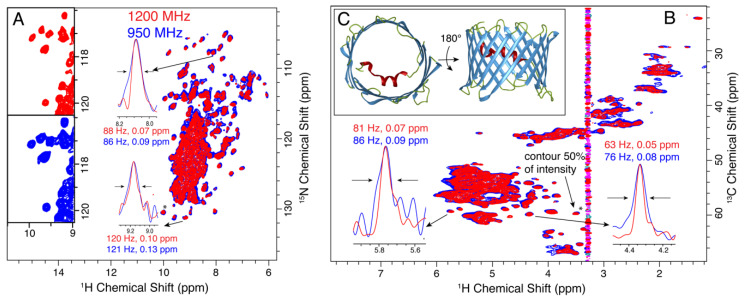
Figure 3.
Improved resolution of 2D crystalline α-PET hVDAC at 1200 MHz (red) compared with 950 MHz (blue). (A,B) show the (H)NH and (H)CH spectra, respectively. An expanded view in (A) shows the spectra side by side. The inlays show the improvement in line widths on the ppm scale for proton. The insets show the linewidths of selected peaks that are resolved in the 2D spectrum. The peak indicated with a (*) was used to set the base contour level to a consistent fraction of the peak intensity for each set of overlaid spectra. Panel (C) Shows the 3D structure of VDAC (pdb: 3EMN). α-helical regions are shown in red, β-strands in blue, loops in green. The t1 noise at about 3.3 ppm is from choline protons.

