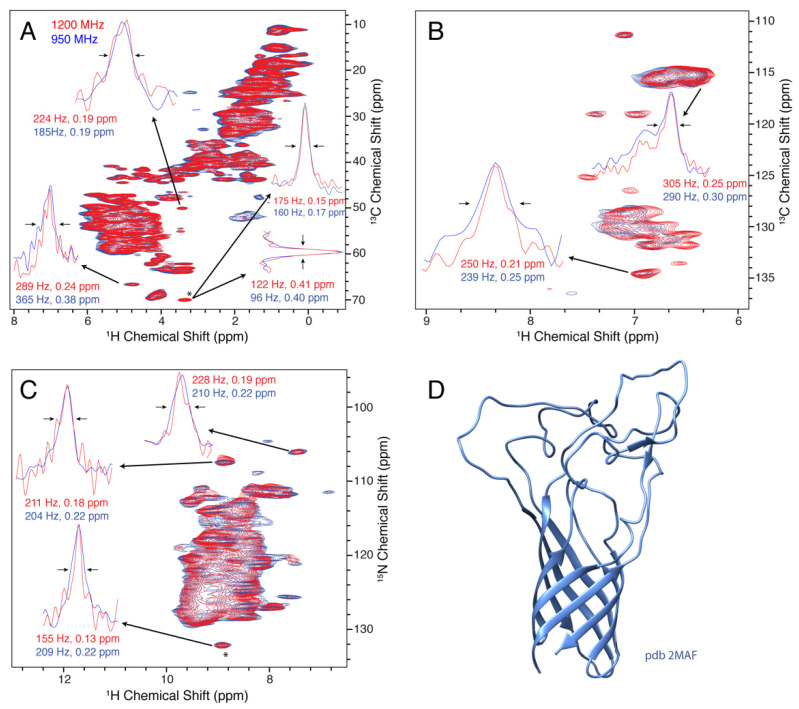
Figure 4.
Resolution of the beta barrel protein Opa60 at 1200 MHz (red) and 950 MHz (blue). (A–C) show the aliphatic (H)CH, aromatic (H)CH, and (H)NH spectra, respectively. The insets show the linewidths of selected peaks that are resolved in the 2D spectrum. The peak indicated with a (*) was used to set the base contour level to a consistent fraction of the peak intensity for each set of overlaid spectra. In (D), the solution structure (pdb 2MAF) is shown.

