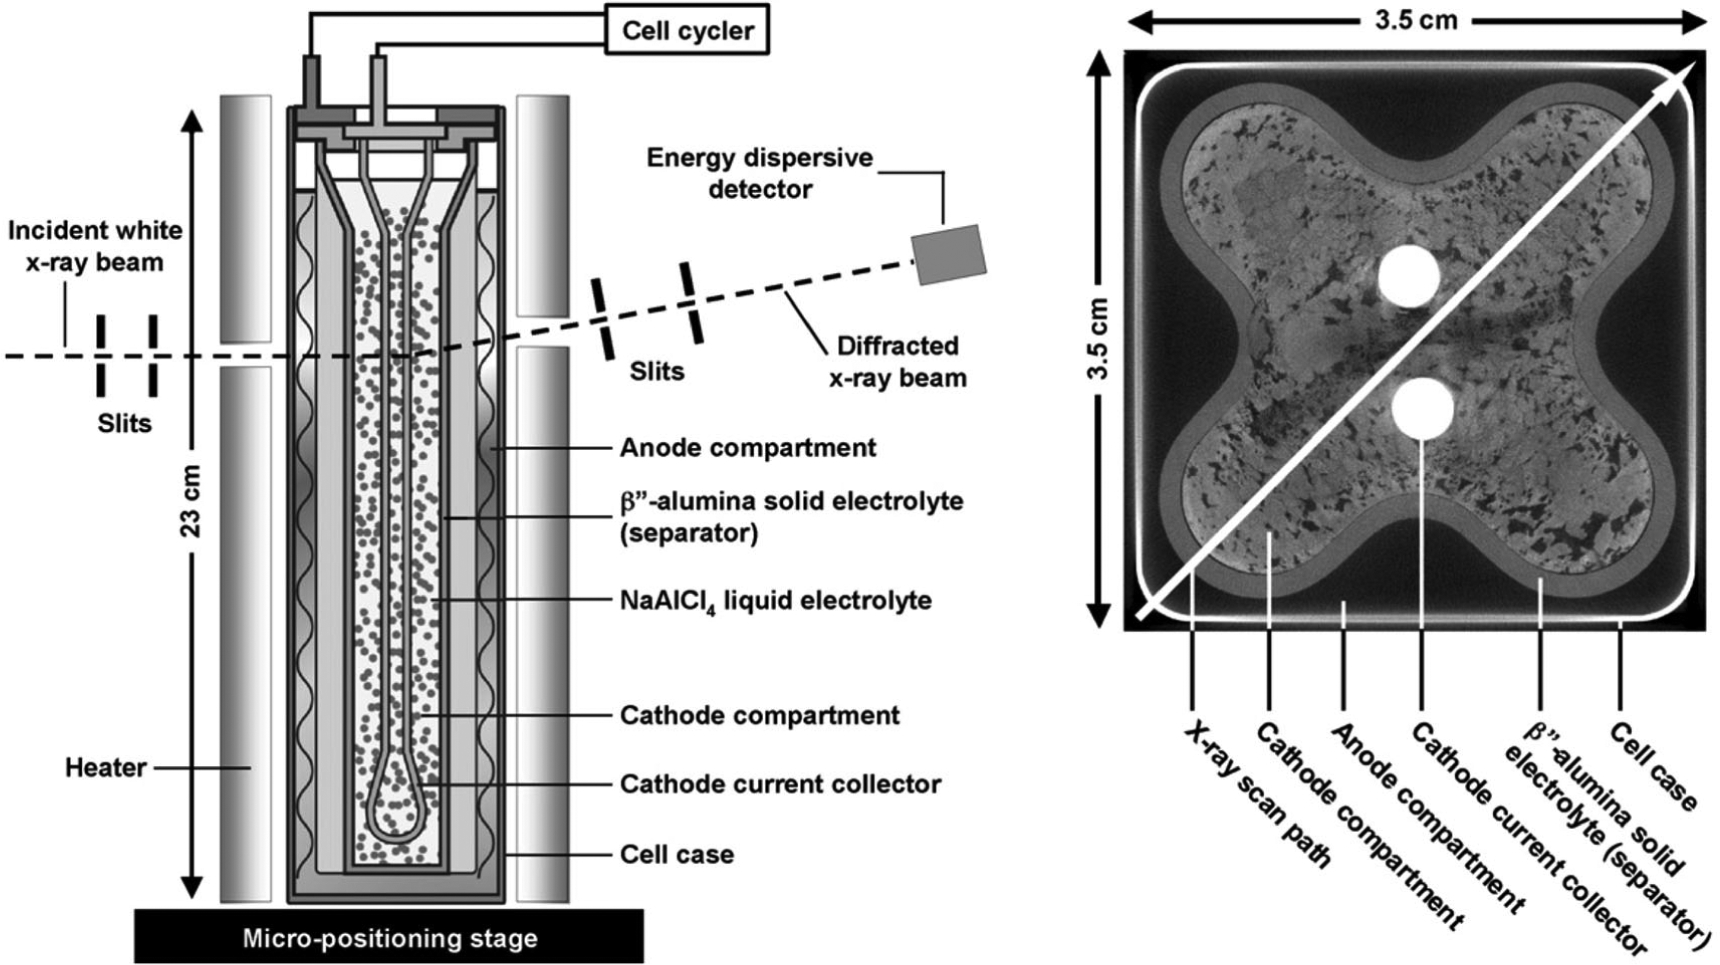
Figure 15.

Sodium metal halide cells. (a) Schematic of the tubular cell in the EDXRD experimental setup. (b) Cross-sectional computed tomography (CT) image of a cell showing arrangement of the electrodes. The arrow along the cell diagonal denotes the path of EDXRD spatial profiling, requiring an X-ray penetration depth of up to 50 mm. (Reproduced with permission from Ref. 9. Copyright Elsevier, 2011.)
