
Fig. 4. Microglia-astrocyte Sema4D-PlexinB2 signaling promotes CNS inflammation in EAE.
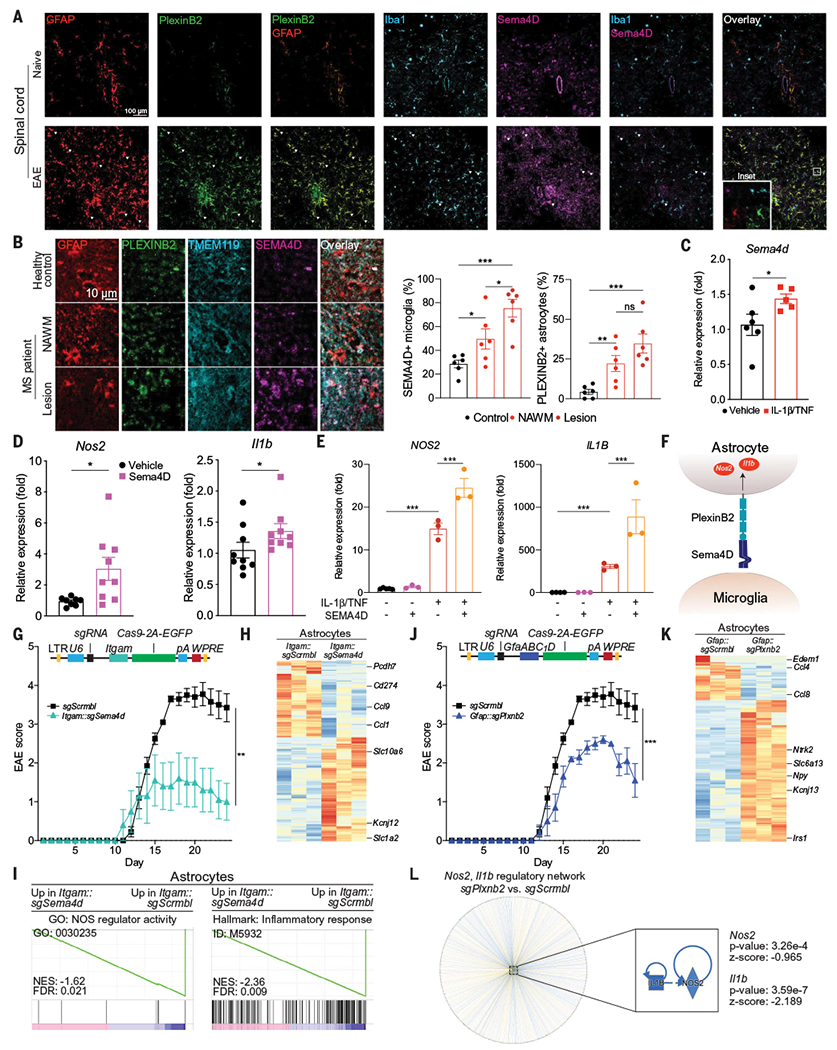
(A) Immunostaining analysis of PlexinB2, GFAP, Ibal, and Sema4D in the spinal cords of naïve and peak-EAE mice. Images are representative of n = 3 mice per group. (B) Immunostaining of MS patient and healthy control CNS tissue. n = 6 images from N = 3 patients per region. Statistical analysis: unpaired two-tailed t test. NAWM, normally appearing white matter. (C) Sema4d expression determined by quantitative PCR (qPCR) in primary mouse microglia treated with IL-1β/TNF versus vehicle. n = 6 vehicle, n = 5 IL-1β/TNF. Statistical analysis: Kolmogorov-Smirnov t test. (D) Nos2 and Il1b expression determined by qPCR in primary mouse astrocytes treated with a recombinant Sema4D fragment with agonistic activity. n = 9 samples per group, n = 8 samples for Nos2 vehicle. Statistical analysis: Kolmogorov-Smirnov t test per group. (E) Nos2 and Il1b expression determined by qPCR in primary human fetal astrocytes treated with the indicated compounds. n = 5 vehicle Nos2, n = 4 vehicle Il1b, n = 3 otherwise. Statistical analysis: unpaired two-tailed t test. (F) Schematic depicting microglial Sema4D binding PlexinB2 expressed in astrocytes. (G) EAE disease course in mice transduced with Itgam::Cas9 coexpressing sgSema4d- or sgScrmbl-targeting lentiviruses. n = 10 sgScrmbl, n = 5 sgSema4d mice. Statistical analysis: two-way repeated measures analysis of variance (ANOVA). (Top) Schematic of lentiviral vector. Lentiviral transduction occurred 7 days before EAE induction to avoid targeting recruited myeloid cells. (H and I) RNA-seq analysis of gene expression (H) and GSEA preranked (I) of astrocytes isolated from mice transduced with Itgam::sgSema4d or Itgam::sgScrmbl. (J) EAE disease course in mice transduced with Gfap::Cas9 coexpressing sgPlxnb2 or sgScrmbl. n = 10 sgScrmbl, n = 5 sgPlxnb2 mice. Statistical analysis: two-way repeated measures ANOVA. (Top) Schematic of lentiviral vector. (K) Differential gene expression determined by RNA-seq in astrocytes from mice transduced with Gfap::sgPlxnb2 versus Gfap::sgScrmbl. (L) Upstream regulator analysis by IPA of Gfap::sgPlxnb2 astrocytes relative to Gfap::sgScrmbl shows down-regulation of Nos2- and Il1b-driven proinflammatory pathways. Data shown as mean ± SEM. *P < 0.05, **P < 0.01, ***P < 0.001. ns, not significant.