. 2020 Feb 5;11(10):2810–2818. doi: 10.1039/c9sc05384k

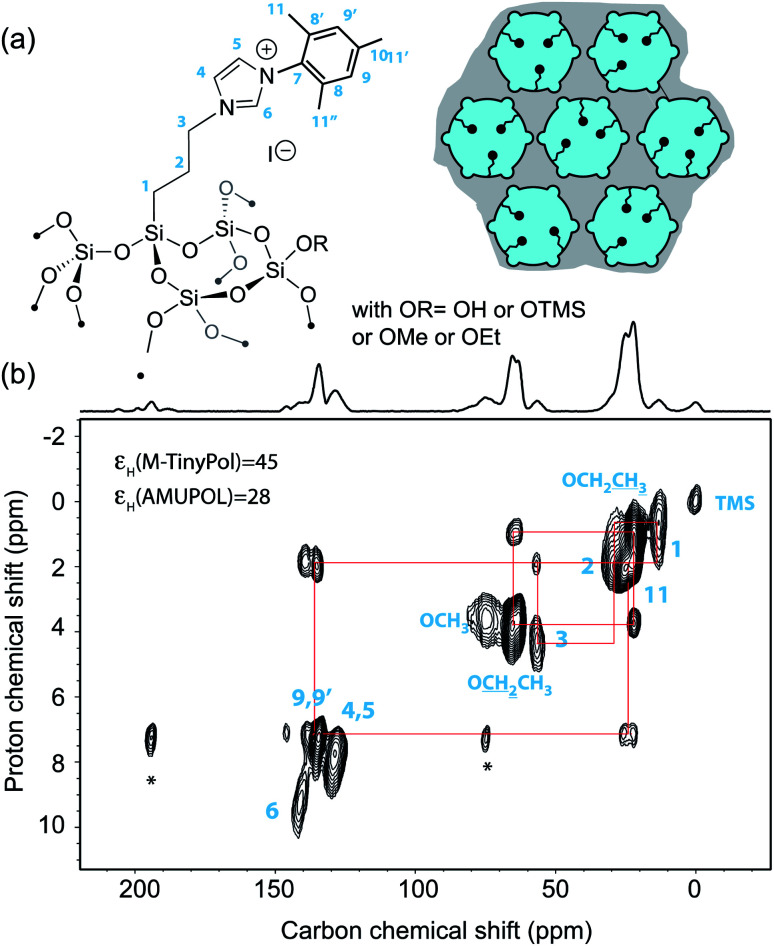
Fig. 6. (a) Structure of the organic imidazolium ligand investigated in this study and schematic representation of the mesoporous silica support [mesopores (6 nm diameter) are shown as circles and micropores (<1 nm diameter) as small half-circles]. Blue color represents the polarizing solution of 10 mM AMUPol or M-TinyPol in H2O that fills the pores while the gray area represents the silica bulk. (b) Contour plot of a 2D DNP SENS 1H–13C HETCOR spectrum of the surface compound recorded at 18.8 T and 12.5 kHz MAS frequency using a 3.2 mm rotor. The sample was impregnated with a 10 mM solution of TinyPol in H2O. The contact time was 500 μs. During t1, eDUMBO homonuclear decoupling was applied.47 The one-dimensional carbon-13 cross-polarization spectrum is shown above the 2D map. The red lines show the various correlations.

Fig. 6