. 2020 Feb 3;11(10):2819–2827. doi: 10.1039/c9sc06260b

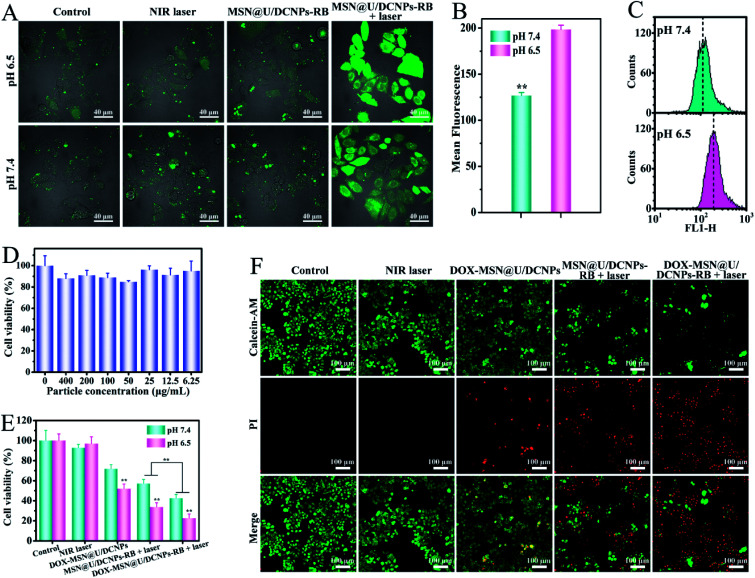
Fig. 4. (A) CLSM images of DCFH-DA stained 4T1 cells after different treatments with a NIR laser, MSN@U/DCNPs–RB, and MSN@U/DCNPs–RB + NIR laser at different pH values. (B) Mean fluorescence intensity of 4T1 cells treated with MSN@U/DCNPs–RB + NIR laser at different pH values. (C) Quantitative analysis of the intensity of the green fluorescence of the cells by flow cytometry. (D) Viability of 4T1 cells incubated with bare MSN@U/DCNPs at different concentrations for 24 h. (E) Viability of 4T1 cells subjected to different treatments at different pH values. (F) The corresponding fluorescence images of live–dead stained 4T1 cells after different treatments at pH 6.5.

Fig. 4