. 2020 Feb 10;11(11):3007–3015. doi: 10.1039/c9sc05392a

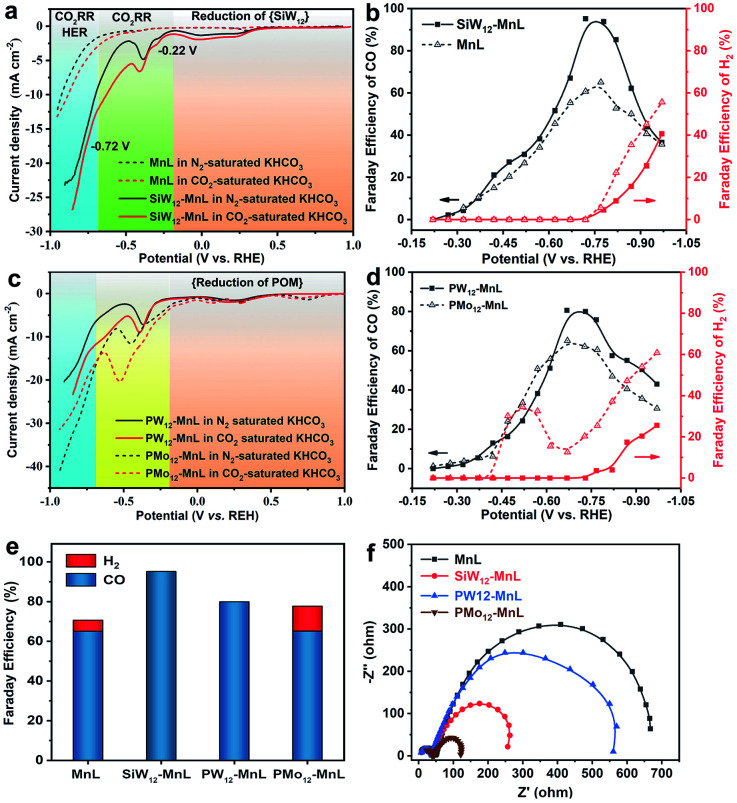
Fig. 3. (a) The LSV curves of SiW12–MnL/KB and MnL/KB in 0.5 M N2-(black curve) or CO2-(red curve) saturated KHCO3 electrolyte. (b) The FE of CO at different potentials for MnL/KB and SiW12–MnL/KB (the line is drawn only to guide the eye). (c) The LSV curves of PW12–MnL/KB and Pmo12–MnL/KB in 0.5 M N2-(black curve) or CO2-(red curve) saturated KHCO3 electrolyte. (d) The FE of CO at different potentials for PW12–MnL/KB and PMo12–MnL/KB (the line is drawn only to guide the eye). (e) The FE values of CO and H2 at the overpotential of the highest FE of CO for MnL/KB and POM–MnL/KB. (f) Nyquist plots of electrochemical impedance spectra (EIS) of MnL/KB and POM–MnL/KB in CO2-saturated 0.5 M KHCO3 aqueous solution.

Fig. 3