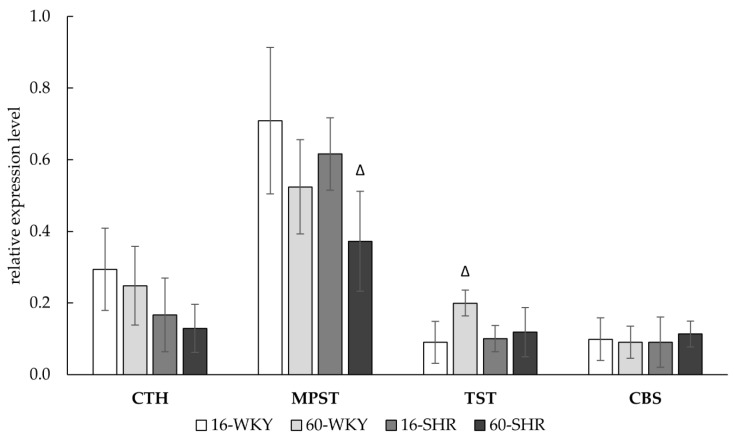
Figure 4.
Relative expression level of CTH, MPST, TST, and CBS gene in rats’ livers. Rats were divided into the following groups: 16-week-old Wistar Kyoto rats (16-WKY), 60-week-old Wistar Kyoto rats (60-WKY), 16-week-old Spontaneously Hypertensive Rats (16-SHR), and 60-week-old Spontaneously Hypertensive Rats (60-SHR). Bands were normalized using GAPDH gene, the mean of which was taken as equal to one. Values represent an arithmetic mean ± S.D. of three animals. Δ p < 0.05 16-week-old vs. 60-week-old (Mann–Whitney test).

