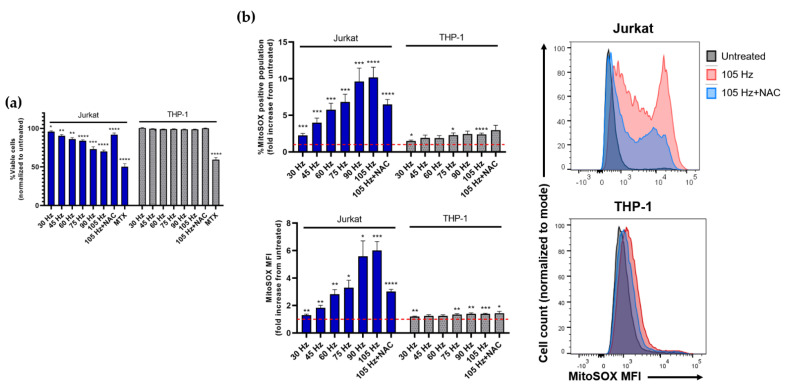
Figure 3.
NTP induces cytotoxicity in Jurkat cells but not in THP-1 in a frequency-dependent manner up to 105 Hz. (a) Viability of Jurkat and THP-1 cells 24 h post NTP exposure. (b) Mitochondrial superoxide production increased in both Jurkat and THP-1 cells 24 h post-NTP exposure, measured both as percent MitoSOX-positive cells and overall mean fluorescence intensity (MFI). Dotted line indicates no change with respect to cells not exposed to NTP. Data are presented as mean ± SEM. Significance was calculated using Brown–Forsythe one-way ANOVA and Dunnett’s post-hoc test (* p < 0.05, ** p < 0.01, *** p < 0.001, **** p < 0.0001).

