. 2020 Jan 27;11(10):2681–2695. doi: 10.1039/c9sc04388h

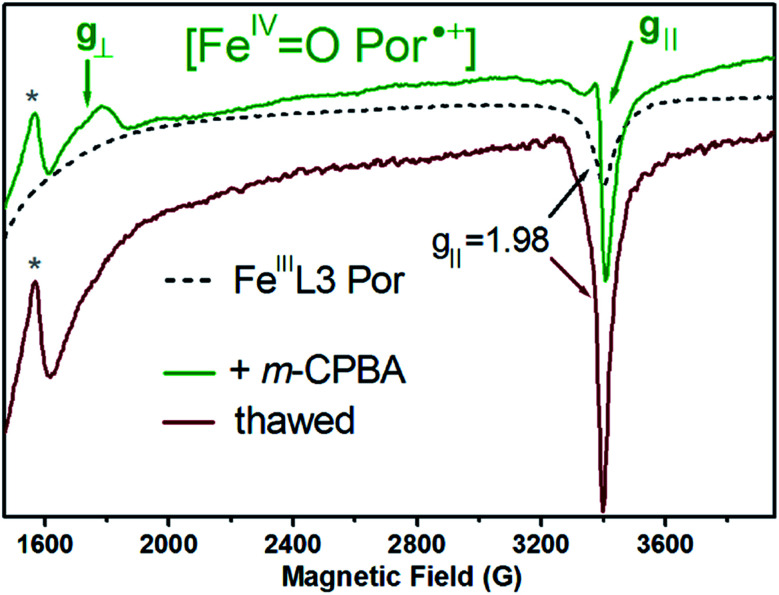
Fig. 7. The 4 K 9 GHz EPR spectra of the [FeIV Created by potrace 1.16, written by Peter Selinger 2001-2019 O Por˙+] intermediate (green trace) trapped when reacting the FeIIIL3 porphyrin complex (black dotted trace, 80 μl at 1.1 mM initial concentration) with m-chloroperbenzoic acid (20 μl at 50 mM initial concentration), both in dichloromethane and for 3 s in a cold bath (at ca. −100 °C) prior to flash freezing in liquid nitrogen. The final molar excess of 10 fold was obtained for the m-CPBA oxidant. When thawing the reacted sample (green trace) for 15 min at 20 °C, spectral changes were clearly observed (dark red trace). The ferric EPR spectrum of the FeIIIL3 porphyrin complex, emulating the contribution of the non-converted complex upon reaction with m-CPBA (dotted black trace), is also plotted to better illustrate the expected difference between the g ≈ 2 components of the ferric and the [FeIV Created by potrace 1.16, written by Peter Selinger 2001-2019 O Por˙+] intermediate. The EPR spectra (3 scans) were recorded at 4 K, 9.48 GHz frequency, 13 G modulation amplitude, 1 mW microwave power, and 100 KHz modulation frequency. The asterisk (*) shows the contribution of free iron (g = 4.3).

Fig. 7