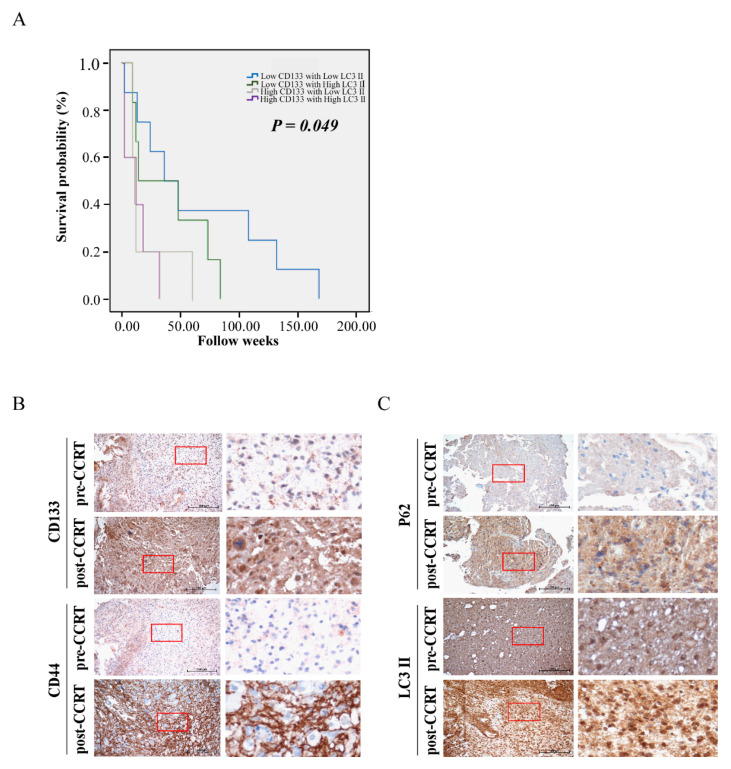
Figure 1.
Correlation of clinic-pathological parameters with autophagic markers and CSCs markers in GBM samples. (A) Kaplan–Meier curves displaying the estimated survival probability for four groups (low-CD133/low-LC3II; low-CD133/high-LC3II; high-CD133/low-LC3II; high-CD133/high-LC3II) in GBM. Each vertical step in the curve indicates one or more events (i.e., deaths), and right-censored patients are indicated by a vertical mark in the curve at the censoring time. (B) Immunohistochemical staining for CSCs-related genes (CD133 and CD44) in two representative human primary GBM (pre-CCRT) and recurrent GBM tumor tissues (post-CCRT) surgical biopsies. (C) Immunohistochemical staining for autophagic genes (P62 and LC3II) in two representative human primary GBM (pre-CCRT) and recurrent GBM tumor tissues (post-CCRT) surgical biopsies. Images on the right represent magnifications of the notified areas in the corresponding left images.

