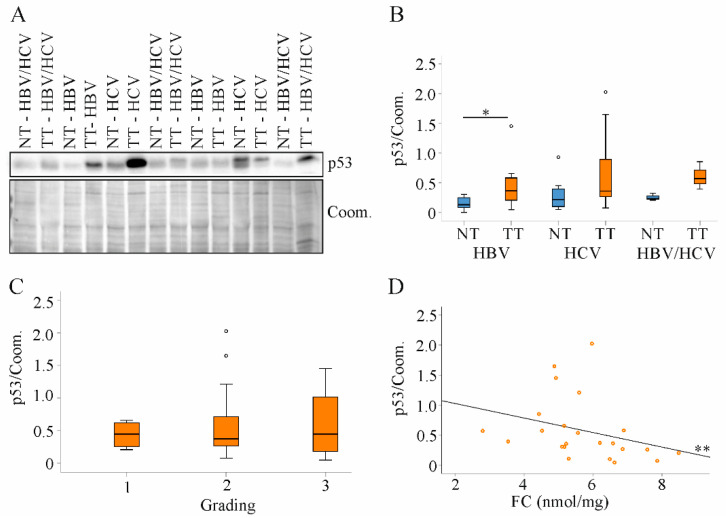
Figure 7.
Expression of p53 protein in non-tumor tissues and tumor tissues of HBV, HCV and HBV/HCV patients. (A) Representative immunoblot of p53 protein analysis; (B) Quantification of p53 protein in non-tumor tissues (NT) and tumor tissues (TT) of all patients. Coomassie (Coom.) stained membrane was used as loading control; (C) Tumor p53 protein in relation to tumor grading; (D) Correlation of p53 protein and free cholesterol (FC) in tumor tissues of all patients. One patient in the HBV group and three patients in the HCV group had p53 protein levels greater than 1. * p < 0.05, ** p < 0.01 (Kruskal-Wallis-Test, One-Way ANOVA and Spearman).

