Figure 1.
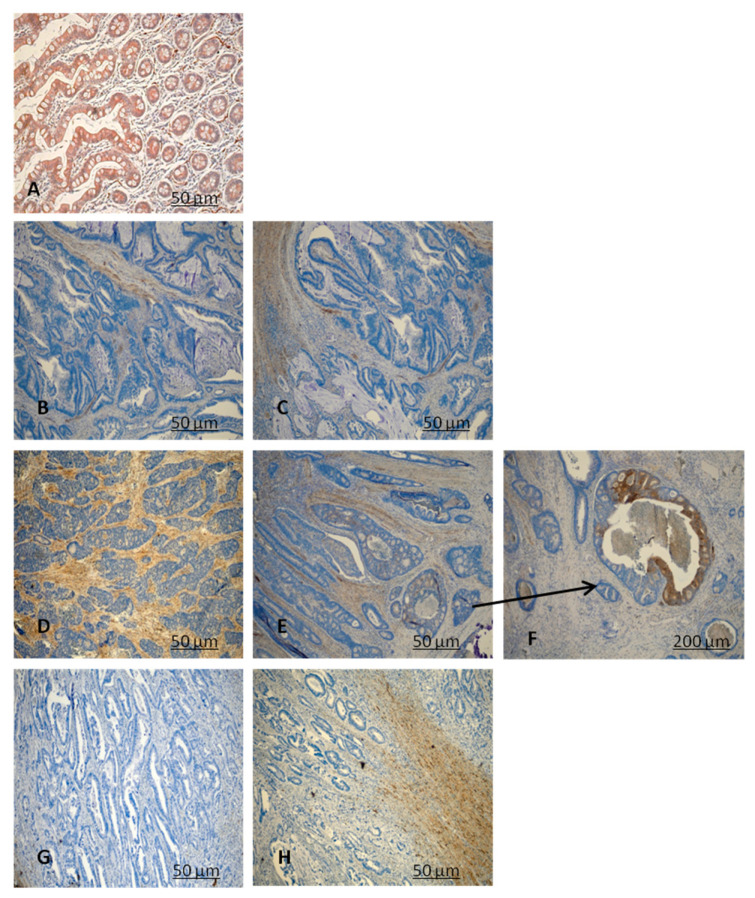
Representative figures of CRYAB protein expression in colorectal cancer (CRC) tissues (B–H) and non-cancerous tissues (A) by immunohistochemistry (IHC) analysis. (A) High expression of CRYAB in non-cancerous cells. (B,C) (well differentiated) low expression in the neoplastic glandular structures; (D–F) (moderately differentiated) high expression of CRYAB in neoplastic cells; (G,H) (poorly differentiated) negative expression of CRYAB in CRC cells. (A–E,G,H) 10×; (F) 40× magnification.

