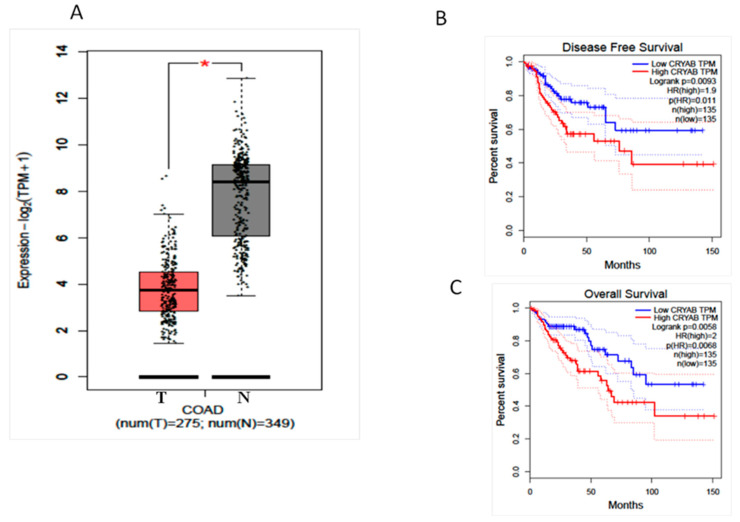
Figure 3.
(A) CRYAB gene expression comparison between groups: COAD-TCGA, adjacent non-tumoral tissue. CRC: colorectal cancer; COAD: colon adenocarcinoma. Median is represented as a solid black line, whereas mean is represented as a black square. p-value cutoff: 0.01. (B) Disease-free survival (DFS) datasets of TCGA of (C) overall survival (OS) and datasets of TCGA.

