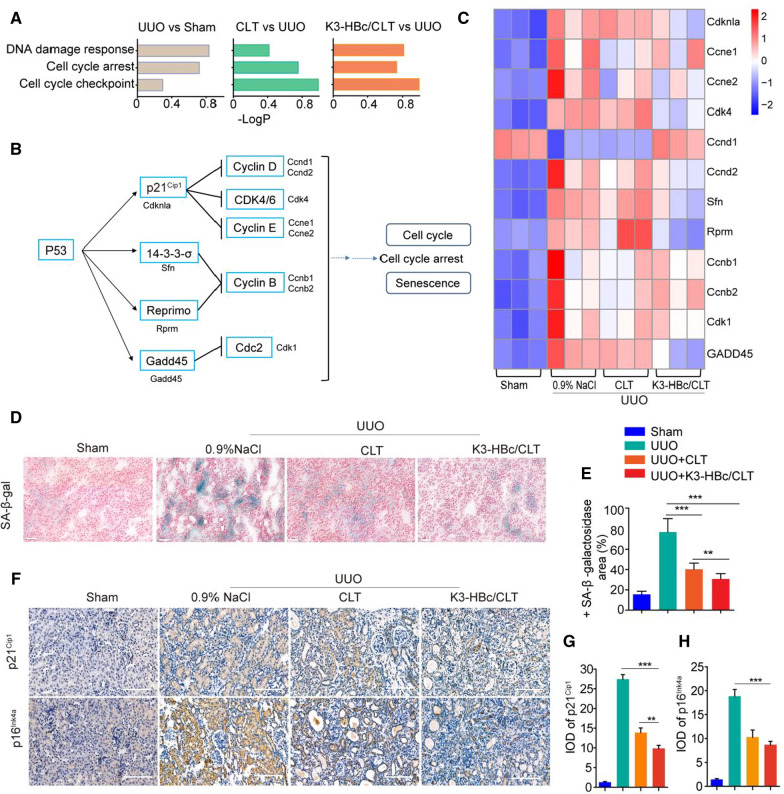
Fig. 6.
K3-HBc/CLT alleviated tubular cell senescence in vitro and in vivo. A Predominant biological process analyses of differentially expressed genes using GO enrichment. B The p53 signaling pathways roadmap and the related genes of cell cycle and cell senescence. C Heatmaps of the most differentially expressed genes in Sham, UUO, CLT and K3-HBc/CLT groups. D Representative renal SA-β-gal staining in sham, UUO, UUO + CLT and UUO + K3-HBc/CLT mice. Scale bar, 50 μm. E Percentage of SA-β-gal positive area in four groups. F Representative micrographs of the expression and distribution of p21Cip1 and p16Ink4a in the kidney sections using immunohistochemical staining and the semi-quantitative IOD analyses of (G) p21Cip1 and (H) p16Ink4a after different treatments as indicated (n = 3). Scale bar, 100 μm (**p < 0.01, ***p < 0.001)

