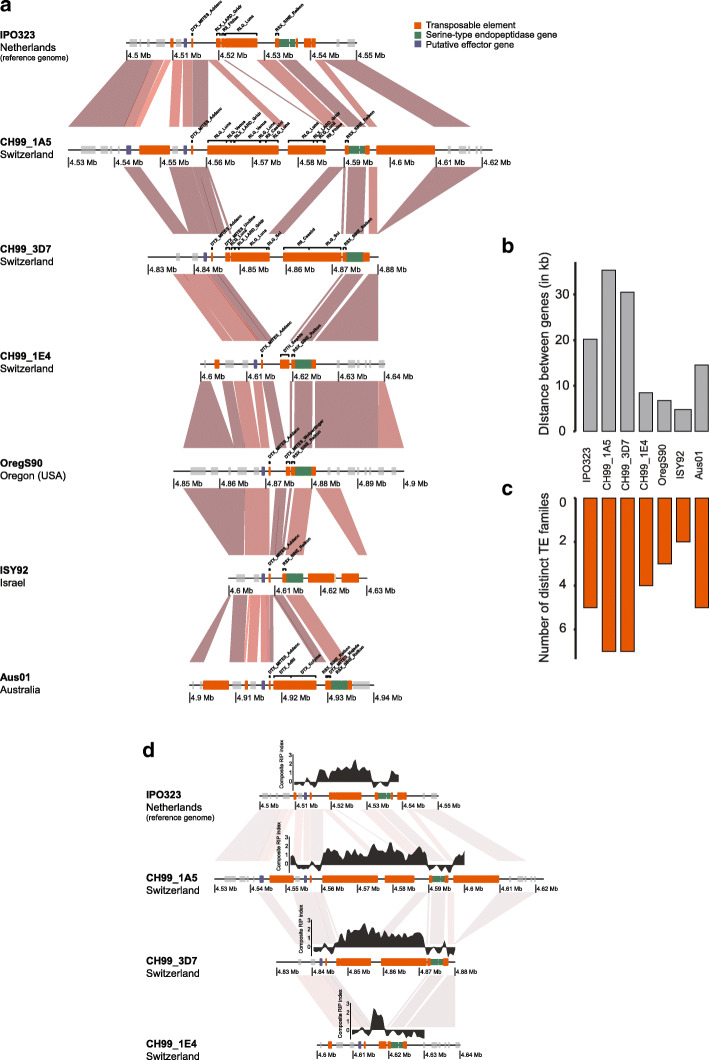
Fig. 3.
TE content variation at the virulence locus. a Synteny plot of the top locus analyzed in seven completely assembled genomes. The red gradient segments represent the percentage of sequence identity from BLASTN alignments. Darker colors indicate higher identity. b Distance variation between the two genes surrounding the top locus (Zt09_1_01590 and Zt09_1_01591). c The number of different TE families found at least once per isolate at the top locus. d Repeat induced point (RIP) mutation signatures in the topic locus. The Large RIP Affected Regions (LRARs) composite index was calculated using the RIPper tool (van Wyk et al., 2019)

