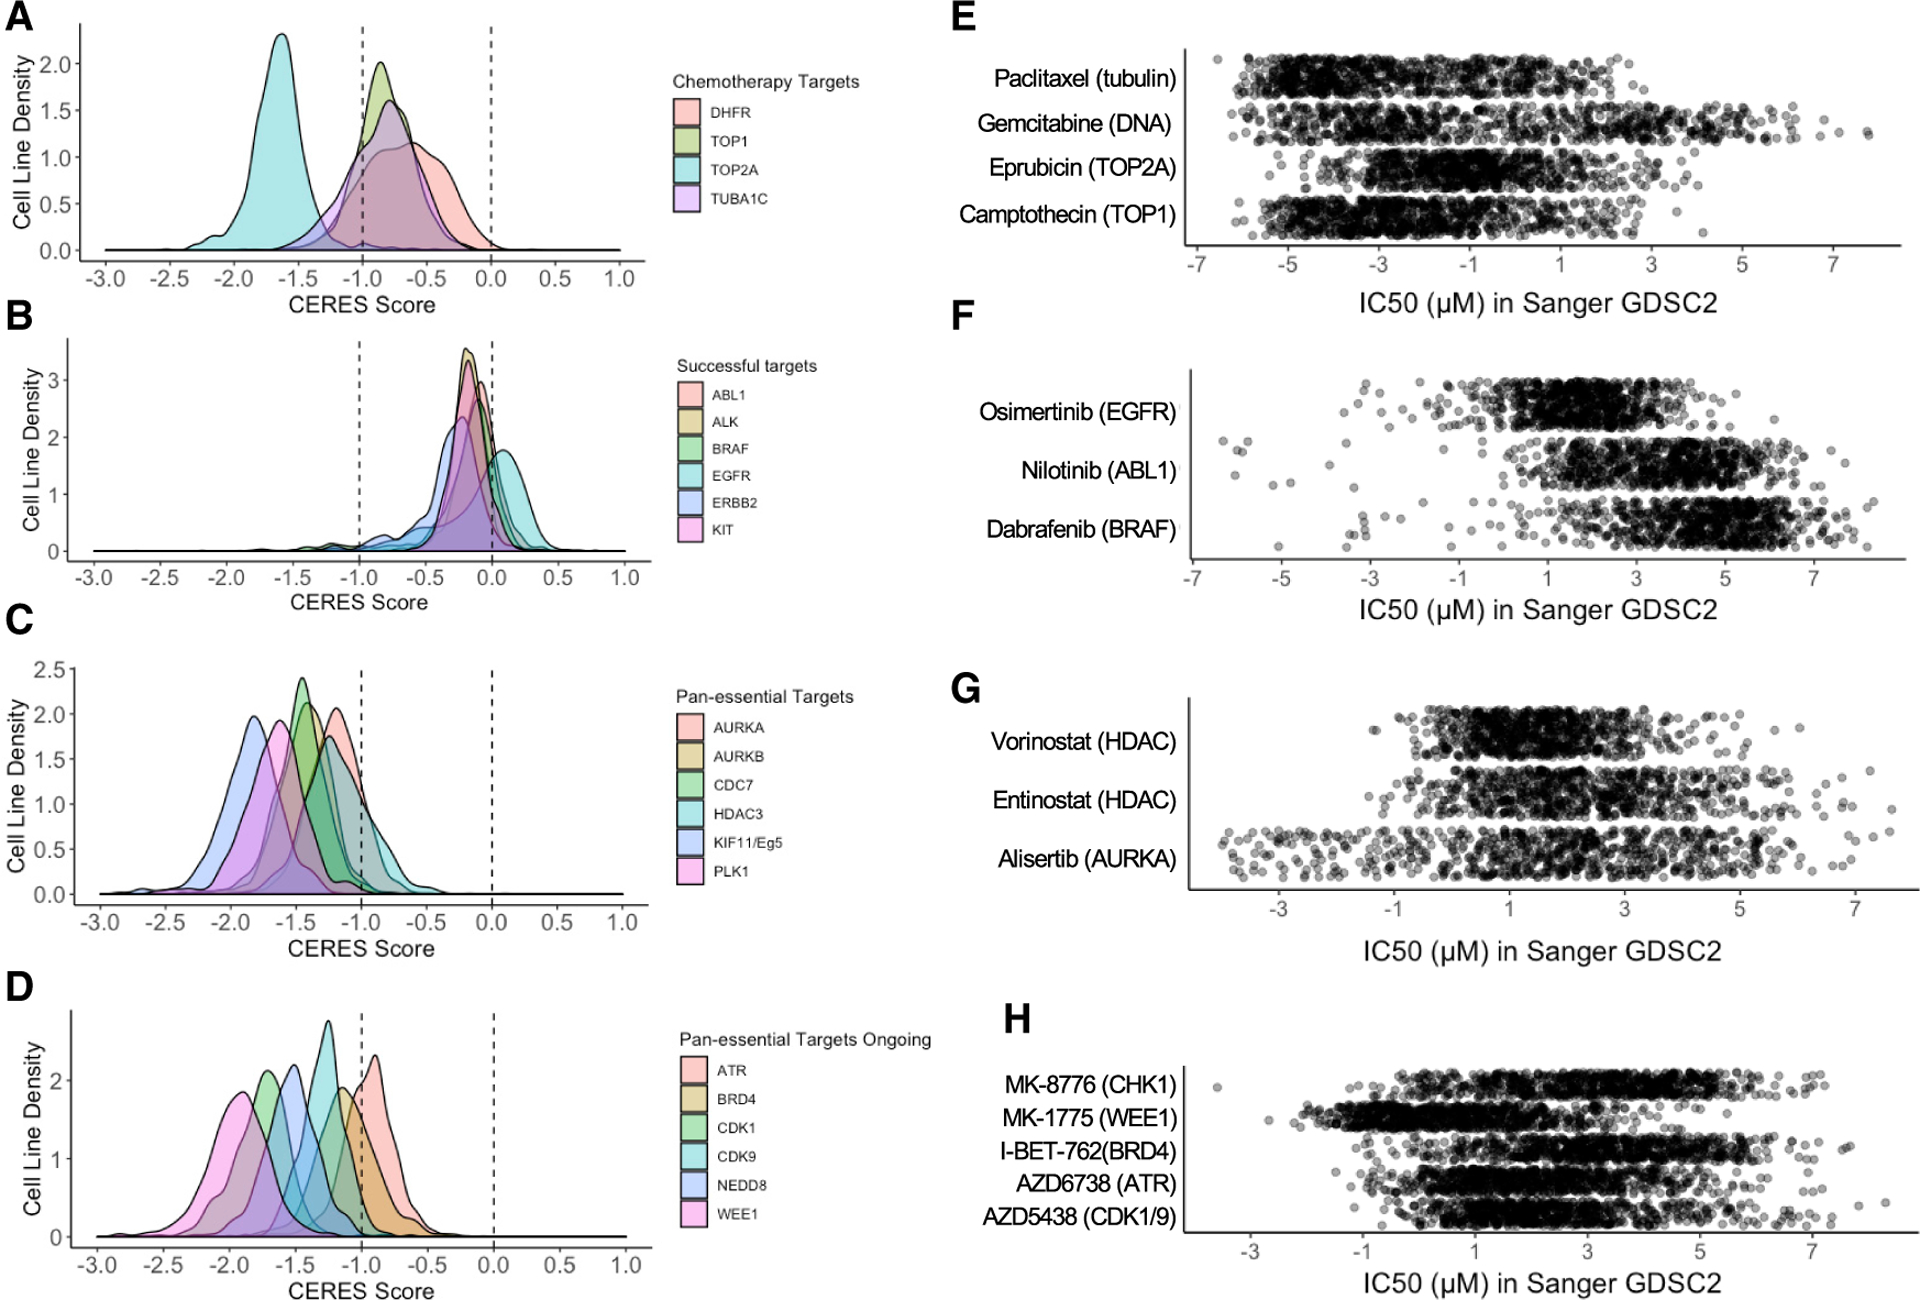
Figure 2. Genome-wide CRISPR knockout and compound profiling in cancer cell lines revealed the pan-essential nature of many cancer drug targets.

(A–D) Density plots representing the CERES score distribution of cancer cell lines after the indicated gene knockout. A CERES score of −1 represents the median effect of knocking out essential genes, and a CERES score of 0 represents no growth disadvantage. CRISPR (Avana) Public 20Q2 dataset from Broad Institute was used in this analysis.
(E–H) Scatterplots representing the IC50 distributions of the indicated drugs and their molecular targets in ~800 cancer cell lines. GDSC2 dataset from Sanger Institute was used in this analysis.
