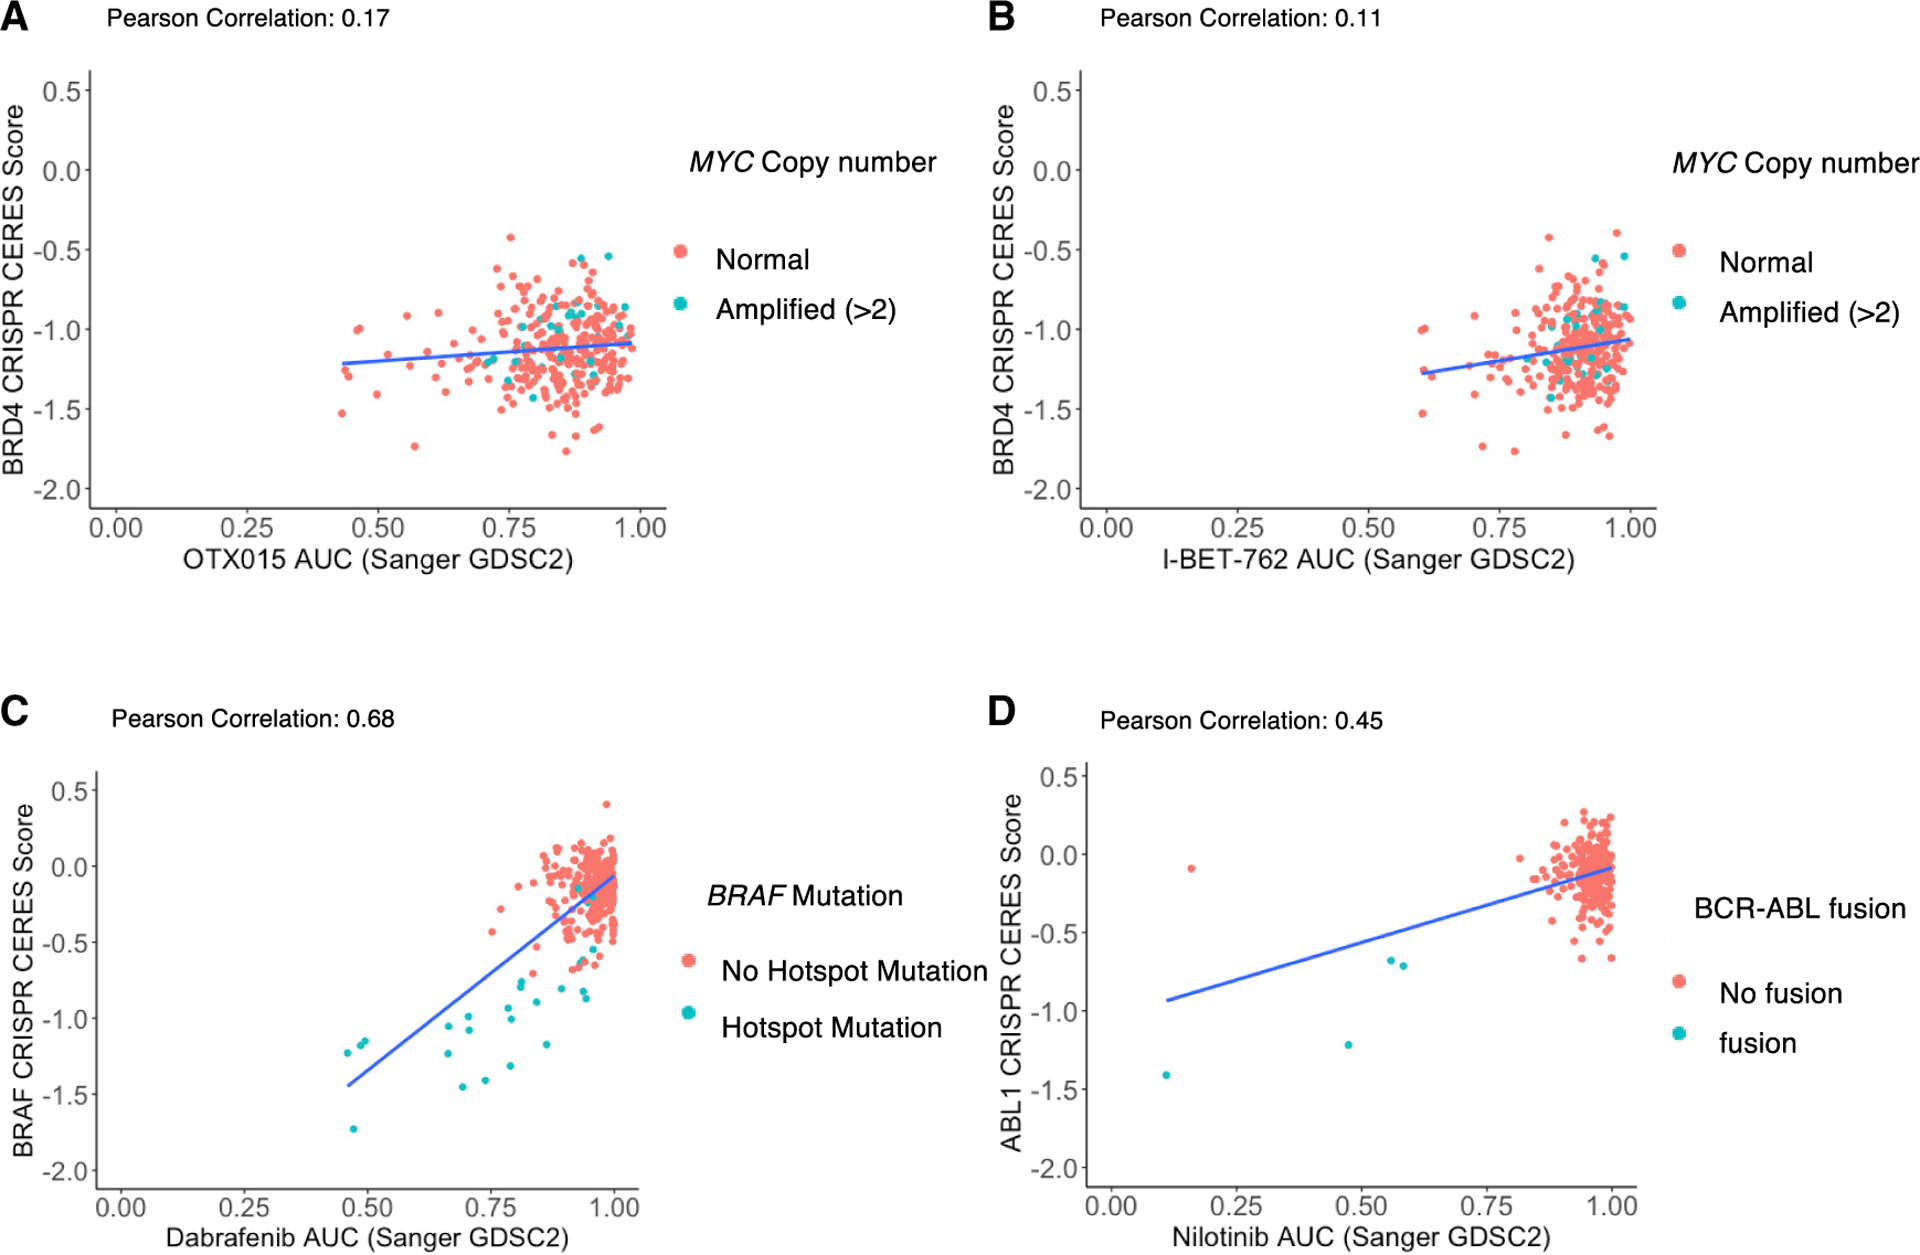
Figure 3. Biomarker correlations with BRD inhibitor, BRAF inhibitor, and ABL inhibitor drug sensitivities.

The AUC values of two BET inhibitors, OTX015 (A) and I-BET-762 (B), are plotted against the CERES score of BRD4 knockouts in the same cell line. The AUC values of the BRAF inhibitor dabrafenib (C) and ABL inhibitor nilotinib (D) are plotted against the CERES score of BRAF knockout in the same cell line. Each dot represents a cancer cell line and red colors represent MYC amplification (A and B), BRAF hotspot mutation (C), or BCR-ABL fusion (D) in the cell line. Genomic and CRISPR data were obtained from Broad Institute Depmap portal. BET inhibitor AUC data were obtained from Genomics of Drug Sensitivity in Cancer Portal.
