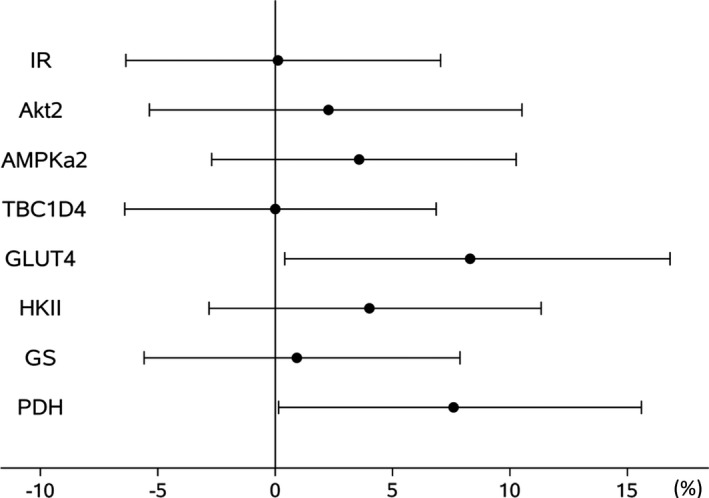
FIGURE 3.

Associations between protein expression and insulin sensitivity across all time points. Results are presented as percentage change (95% confidence interval) in insulin sensitivity per 1 SD change in protein expression. Data for Akt2, AMPKα2 and HKII were log‐transformed for analysis. Abbreviations: Akt2: Rac‐beta serine/threonine‐protein kinase 2; AMPKα2: 5′‐AMP‐activated protein kinase catalytic subunit alpha‐2; GLUT4: glucose transporter 4; GS: glycogen synthase; HKII: hexokinase 2; IR: insulin receptor; PDH: pyruvate dehydrogenase; TBC1D4: TBC1 domain family member 4
