
FIGURE 2.
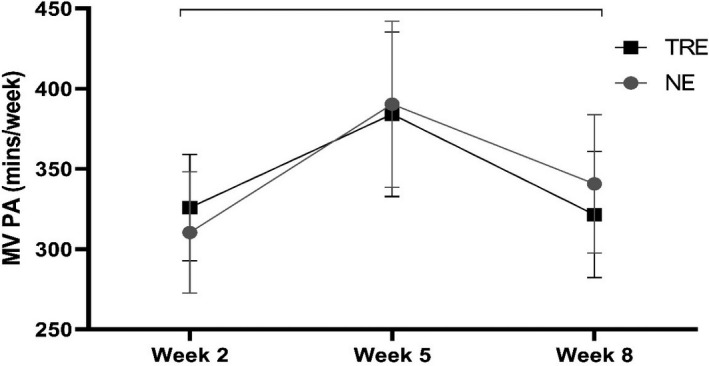
Average time spent in moderate‐to‐vigorous (MV) physical activity (PA). Results display (time‐restricted eating [TRE]: n = 11; normal eating [NE]: n = 10) average minutes (mean ± SE) at Weeks 2, 5, and 8. Brackets indicate a significant change within groups (i.e., time main effects), with no significant differences between groups