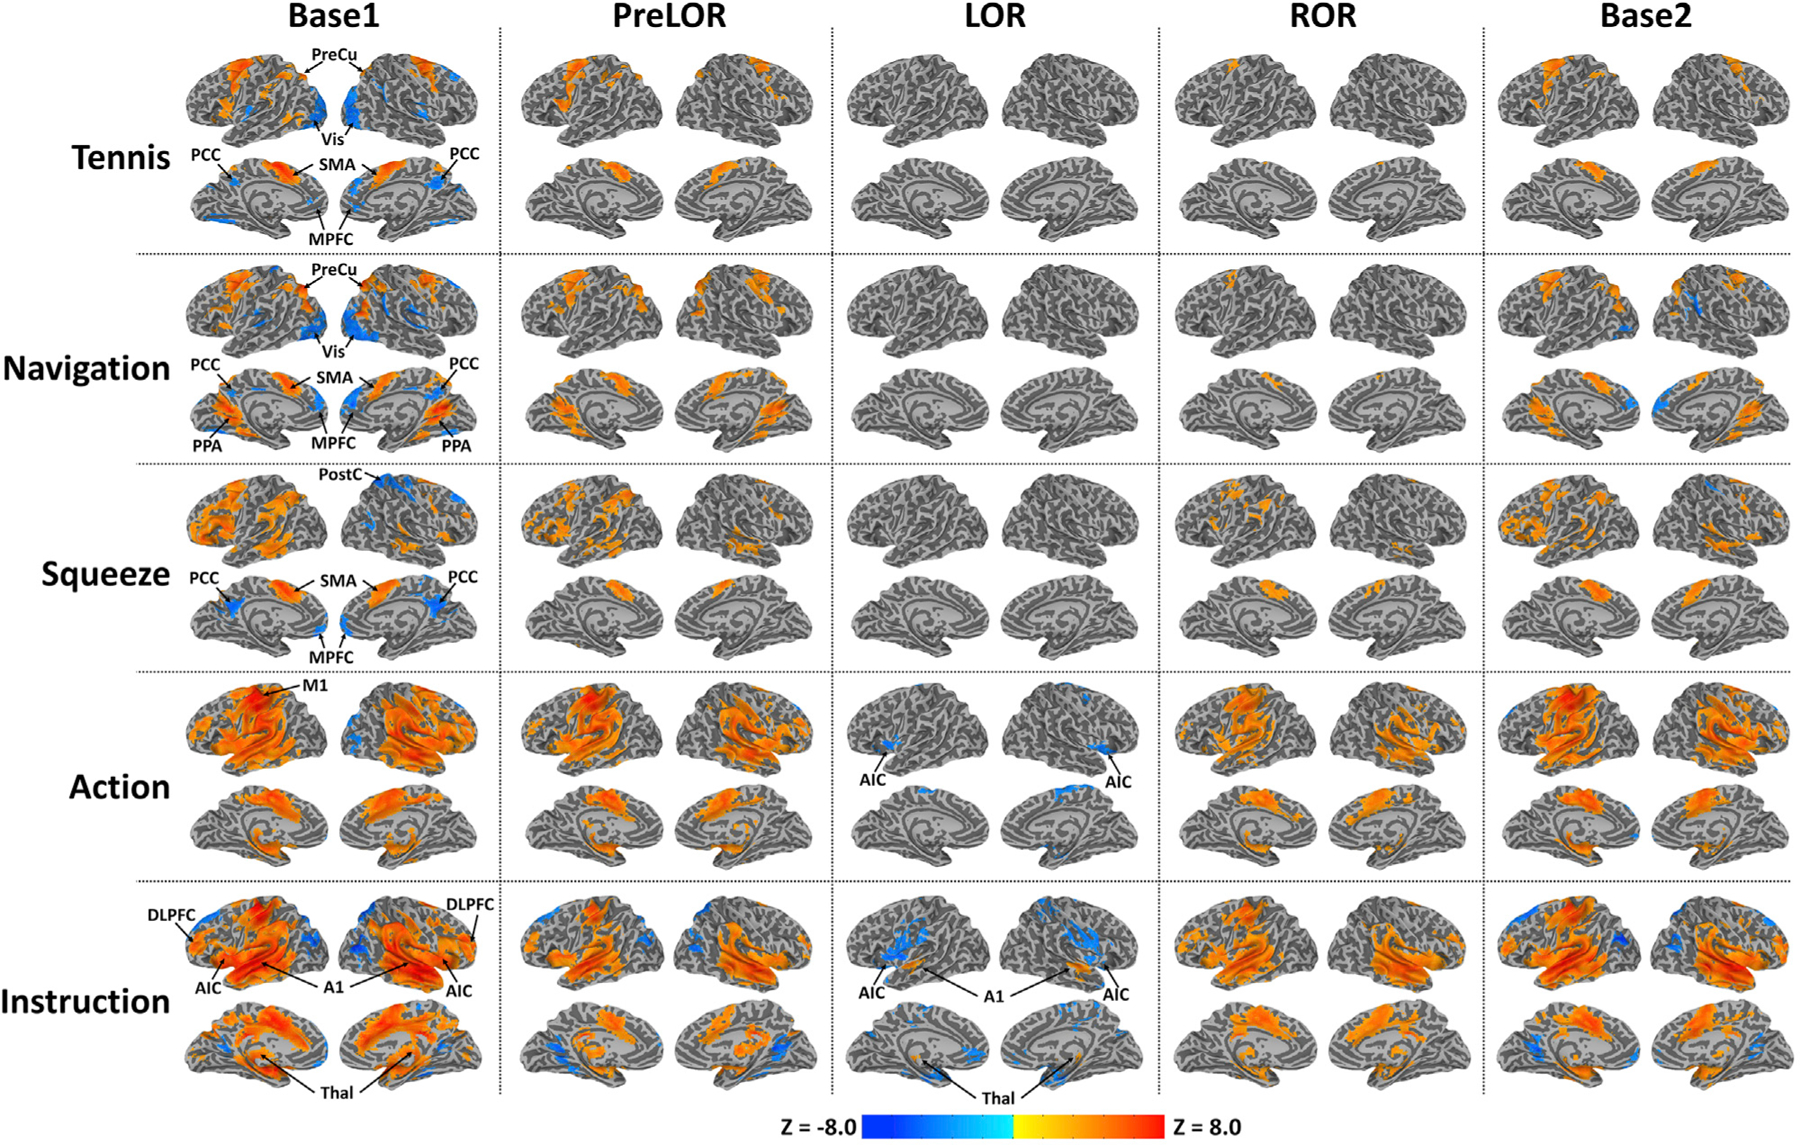
Figure 2. Task-induced brain activity.

Group-level z-maps are shown for tennis imagery (Tennis; 15-s duration), navigation imagery (Navigation; 15-s duration), squeeze imagery (Squeeze; 10-s duration), actual hand squeeze (Action; 2-s duration), and verbal instruction (Instruction; 2-s duration) during Base1 (n = 26), PreLOR (n = 26), LOR (n = 26), ROR (n = 16), and Base2 (n = 25). All z-maps (one sample t test against zero) were corrected at the cluster level α < 0.05. During LOR, mental-imagery-related activations were absent. Verbal-instruction-evoked activations were attenuated and constrained within the Thal and A1, and deactivations were seen in bilateral AIC. SMA, supplementary motor area; PreCu, precuneus; PPA, parahippocampal place area; M1, primary motor cortex; MPFC, medial prefrontal cortex; PCC, posterior cingulate cortex; Vis, visual cortex; PostC, postcentral gyrus; Thal, thalamus; A1, auditory cortex; AIC, anterior insular cortex; DLPFC, dorsal lateral PFC.
