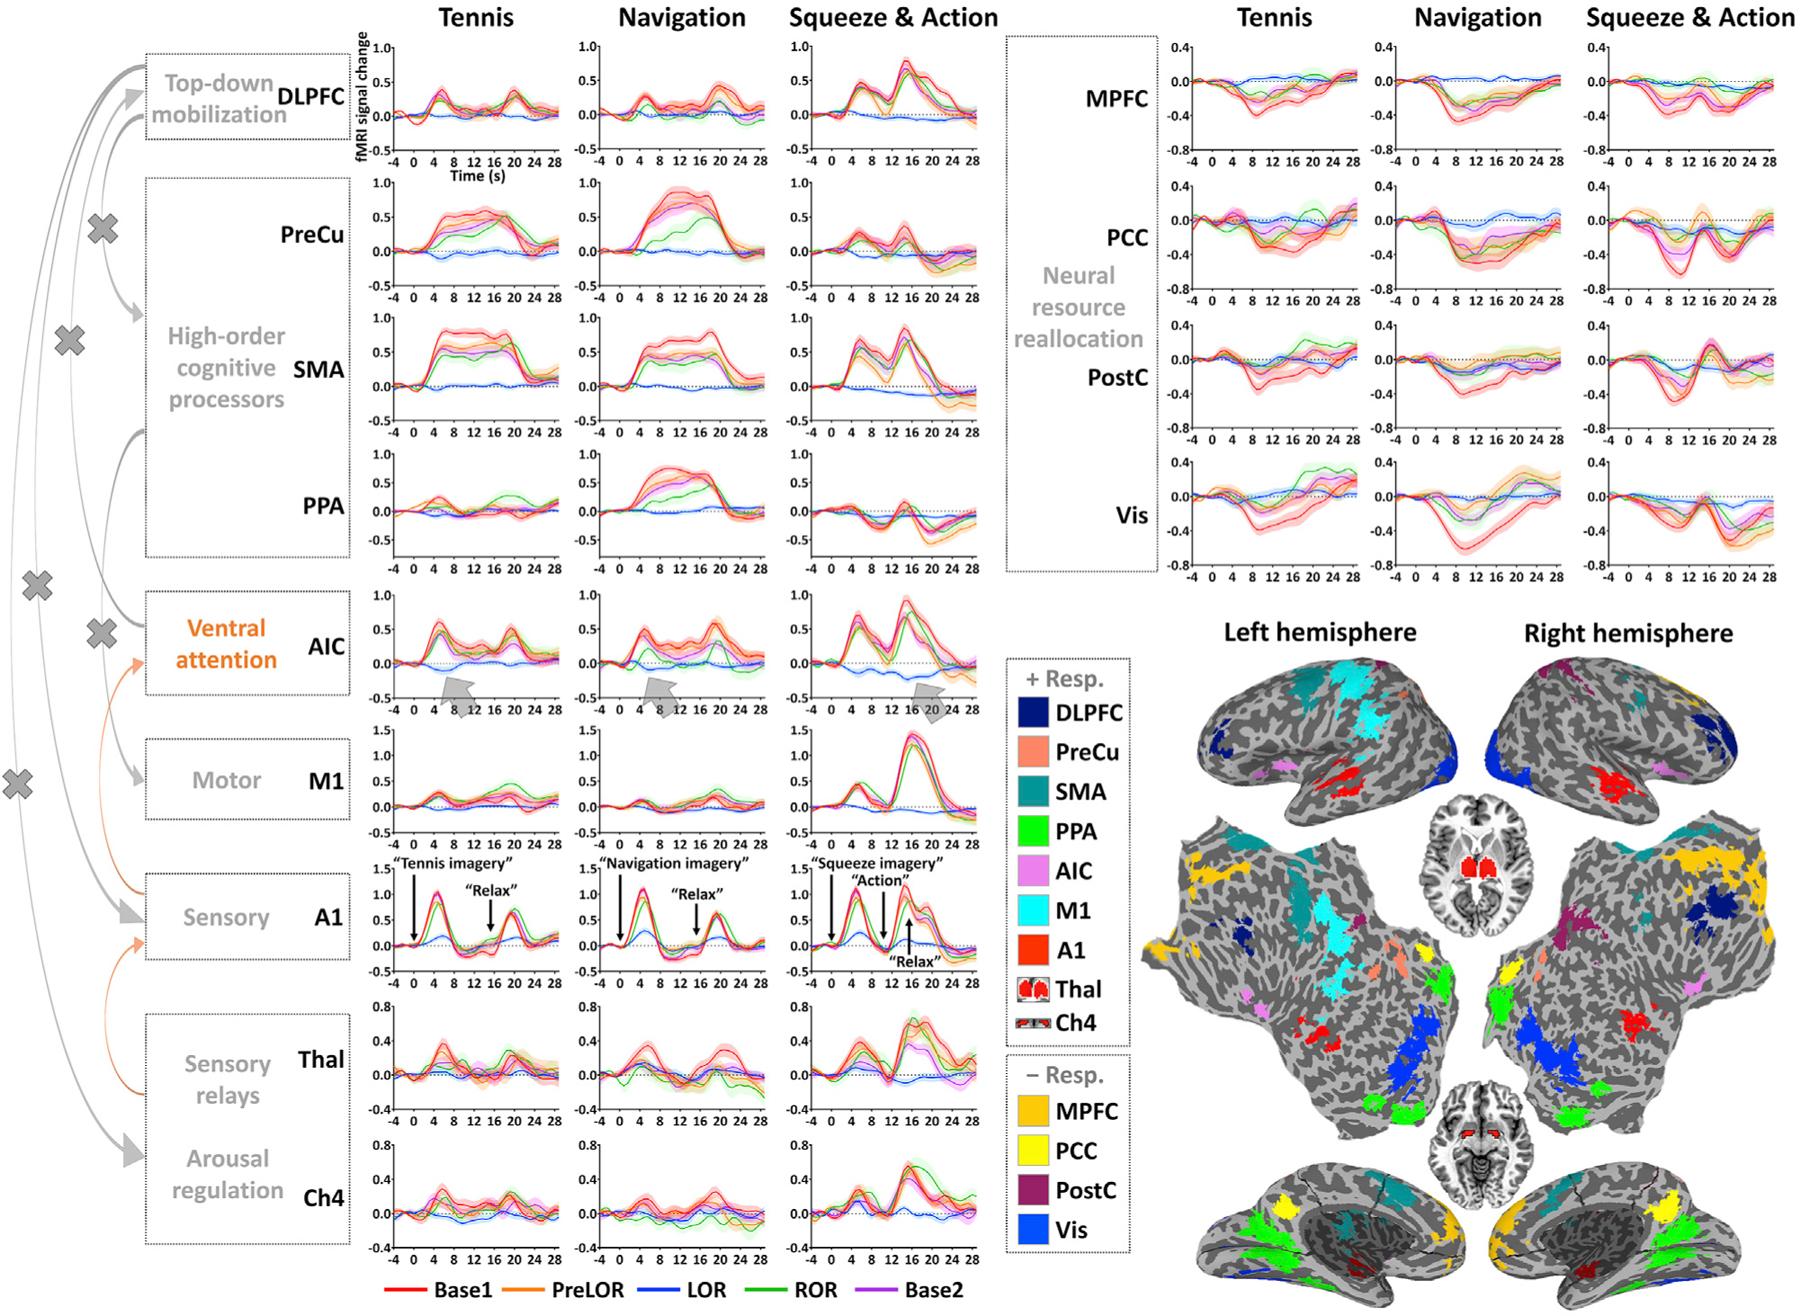
Figure 4. Time course of fMRI signal change in ROIs.

Each time course includes 4.0-s pre-stimulus baseline and 29.6-s post-stimulus period (step: 0.8 s). The fMRI signal is corrected by subtracting the mean value of the pre-stimulus baseline. Time courses are plotted for Base1 (n = 26), PreLOR (n = 26), LOR (n = 26), ROR (n = 16), and Base2 (n = 25). Shaded areas indicate ± SEM across subjects. Brown arrows versus gray arrows on the left indicate preserved versus disrupted cognitive processing pathways during LOR. The deactivations in the AIC represent a functional failure at an intermediate position in the brain’s functional hierarchy. The ROIs are mapped on the inflated and flattened cortical surface (except for Thal and Ch4; see small horizontal sections in the middle). The +Resp. and –Resp. indicate regions showing activation and deactivation, respectively.
