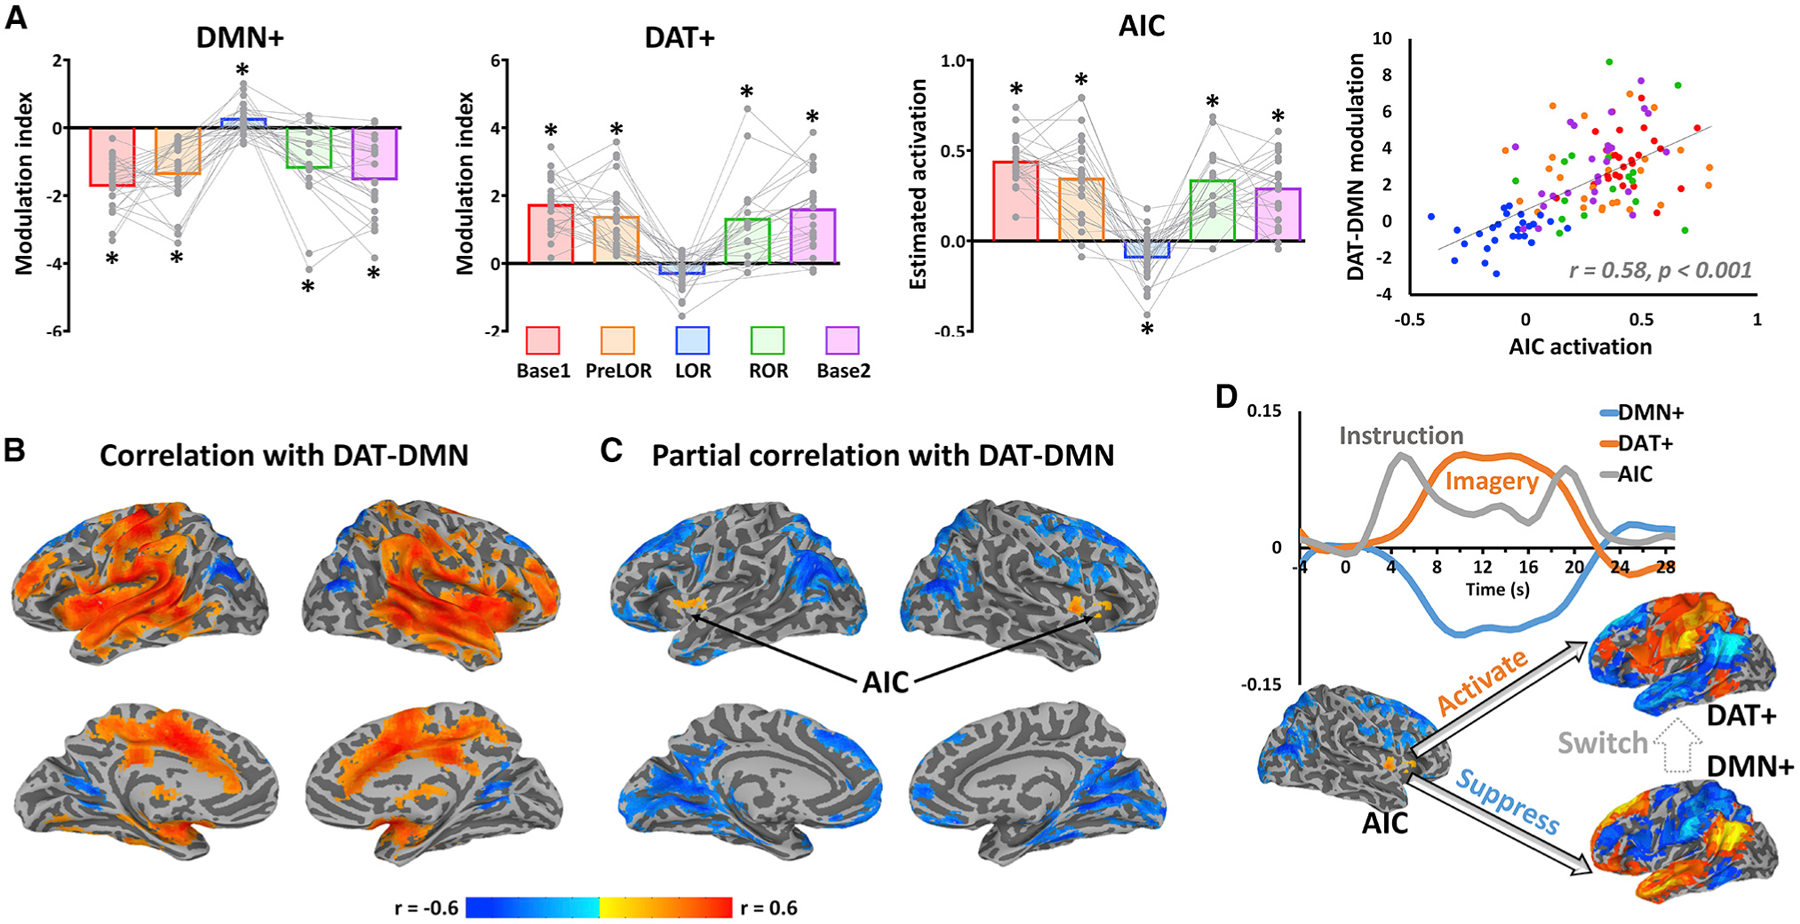
Figure 6. AIC controls the DMN-DAT switches.

(A) Modulation indices were plotted for DMN+ and DAT+. Instruction-evoked activation estimated from general linear model was plotted for the AIC. Each gray dot represents an individual participant during Base1 (n = 26), PreLOR (n = 26), LOR (n = 26), ROR (n = 16), or Base2 (n = 25) connected by gray lines across conditions. Bars represent the group averages for each condition. Asterisk indicates statistical significance (one sample t test against zero) at false discovery rate (FDR)-corrected alpha < 0.05. Pearson correlation was performed between instruction-evoked activation in the AIC and DAT-DMN modulation index across subjects and conditions (n = 119).
(B) Voxel-wise correlation between whole-brain instruction-evoked activation and DAT-DMN modulation index.
(C) Voxel-wise partial correlation between whole-brain instruction-evoked activation and DAT-DMN modulation index by including the activations of A1, Ch4, and Thal as covariates.
(D) Schematic illustration of hypothesized conscious processing. The AIC initiates a large-scale network transition by activating the DAT and suppressing the DMN. The group-averaged time courses are shown as an example for the AIC’s activity (arbitrary unit on y axis for illustrative purpose) and DMN+ and DAT+ spatial similarity during tennis imagery in the baseline condition.
