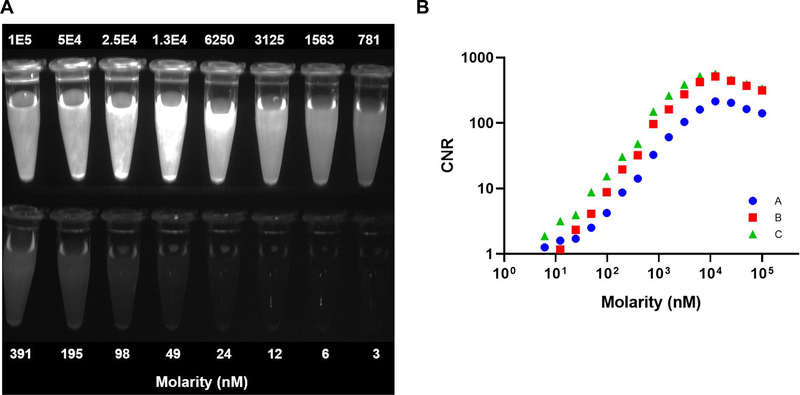
Figure 1. In vitro imaging of MMC(IR800)-TOC for contrast optimization.
(A) Fluorescence-only image of two-fold MMC(IR800)-TOC serial dilutions. Only Set C is shown. (B) Contrast-to-noise ratio (CNR) of the molarity of MMC(IR800)-TOC, measured with three different excitation and emission filter sets (Sets: A =  , B =
, B =  , and C =
  ).
).

