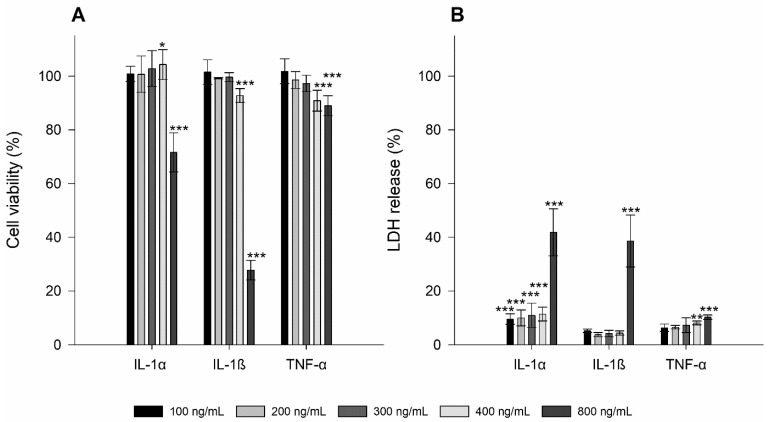
Figure 2.
Cell viability (A) and membrane integrity (i.e., LDH release; (B)) of TR146 cells treated with 100–800 ng/mL IL-1α, IL-1ß, and TNF-α. The percentages given (% ± SD) refer to the corresponding controls. Student’s t-test was used for statistical analysis. Significant differences compared to the control are marked as *, which correspond to a p value ≤ 0.05, **, which corresponds to a p value ≤ 0.01 and ***, which corresponds to a p value ≤ 0.001.

