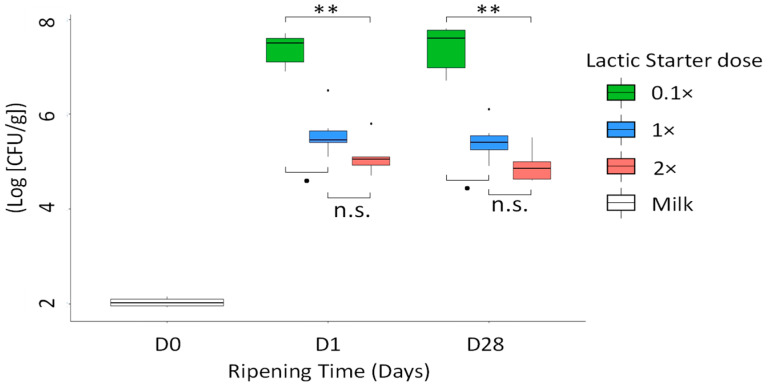
Figure 2.
Level in Log [CFU/g] of STEC O26:H11 in milk (D0) and in cheeses at D1 and D28, according to the lactic starter dose (n = 6). The differences according to the dose were estimated by a multiple comparison test, a Dunn’s test. ** p < 0.01; ● tendency; n.s. non-significant. For milk samples (n = 6), no statistical tests were performed.

