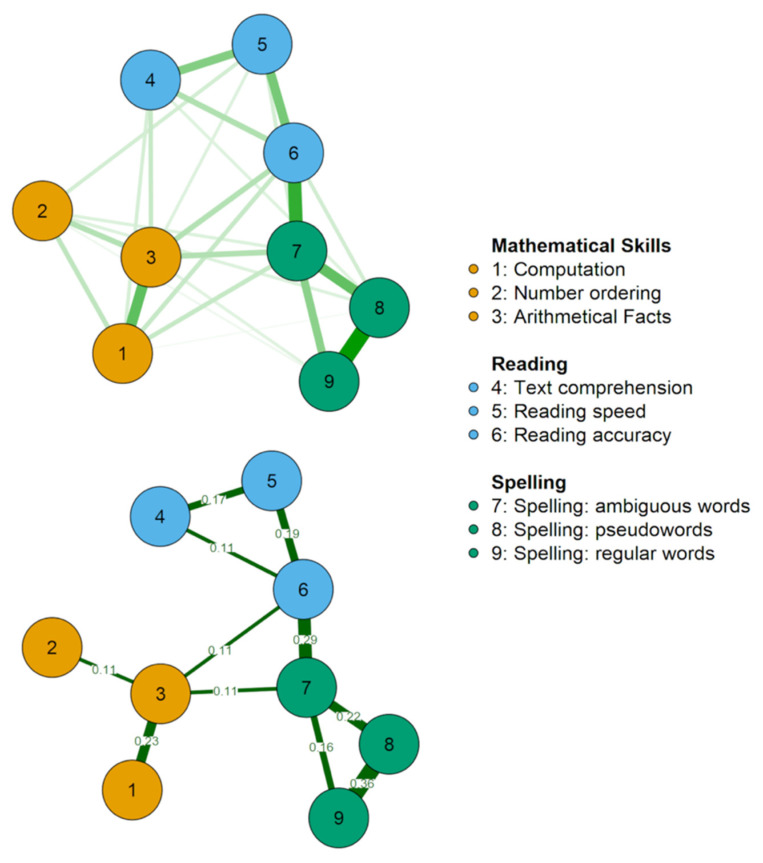
Figure 2.
The upper panel reports every edge estimated as different from 0 by the Gaussian Graphical Model, adopting the eBIC Graphical Lasso method. The edges represent regularised partial correlations. The lower panel shows the same network with graphical changes to improve the readability of the most important connections. Specifically, only edges >0.1 are shown. Notably, these edges are also those that emerged as more stable considering the estimated confidence intervals, estimated over 10,000 bootstrap resampling events (see Figure 3). To make it more readable, colour saturation is not scaled according to the edge strength in the lower panel as done in the upper panel. Green lines indicate positive associations. Red lines would have indicated negative associations (none were observed). The nodes indicate the variables as follows: Computation (1); Number ordering (2); Arithmetical Facts (3); Text comprehension (4); Reading speed (5); Reading accuracy (6); Spelling: ambiguous words (7); Spelling: pseudowords (8); Spelling: regular words (9).

