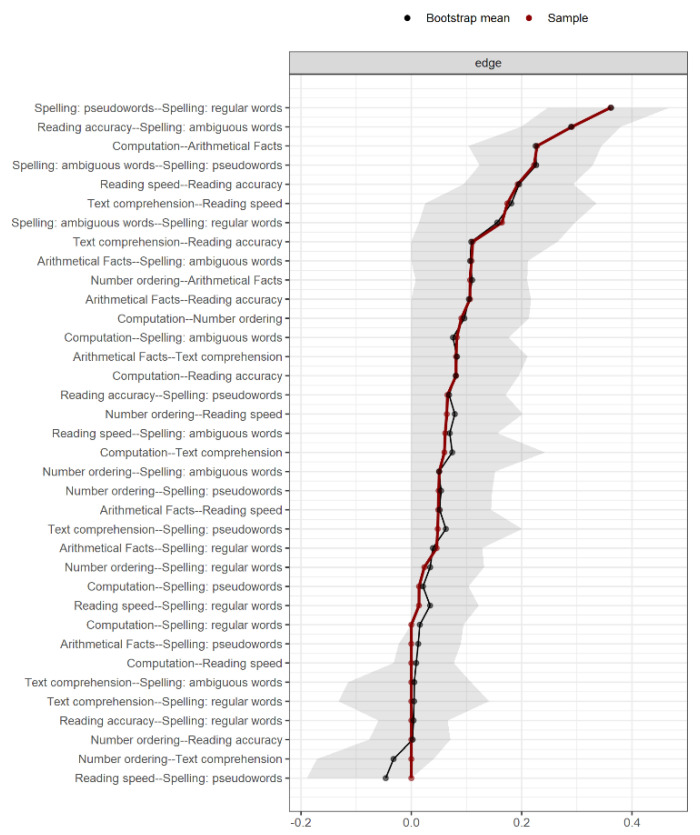
Figure 3.
Full list of edges and results from the 1000 bootstraps. Red dots indicate the edge value of the estimated network. Black dots indicate the average edge value over 1000 bootstrap resampling. The grey shadow represents the 95% confidence interval estimated with the bootstrap resampling. Edges are ordered by their estimated strength.

