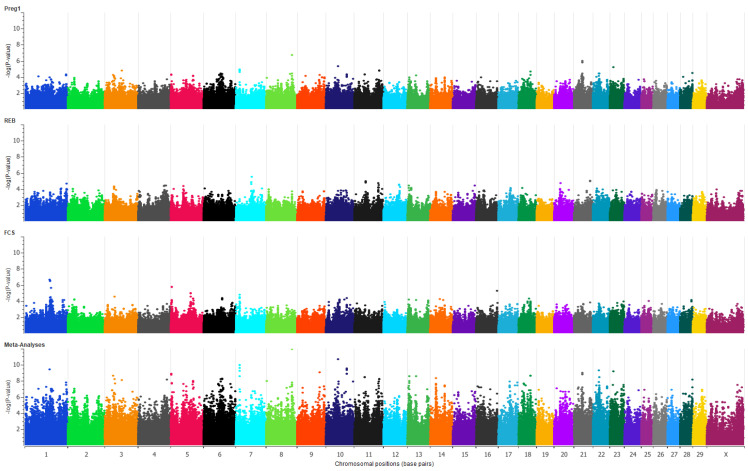
Figure 1.
Genome-wide association studies of three early reproductive traits and their meta-analysis. Polymorphism association plots for pregnancy after first mating opportunity (PREG1), rebreeding score (REB), first conception score (FCS), and multi-trait meta-analysis are represented from top to bottom, respectively. In each plot, the x-axis has the chromosomal positions and the y-axis is the −log(p-value) of each SNP association.

