Fig. 5.
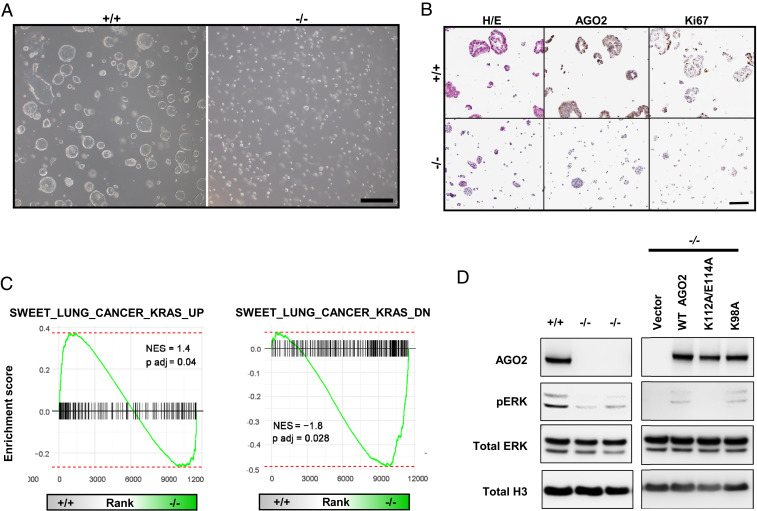
AGO2 promotes MAPK signaling through direct interaction. (A) Organoids isolated from lung nodules of KPC-Ago2+/+ versus KPC-Ago2−/− mice. Bright field image. (Scale bar, 500 μm.) (B) Histological sections of KPC-Ago2+/+ and KPC-Ago2−/− organoids stained with H&E and antibodies directed against AGO2 and Ki67. (Scale bar, 150 μm.) (C) GSEA assessing genes associated with increased KRAS signaling (SWEET_LUNG_CANCER_KRAS_UP and SWEET_LUNG_CANCER_KRAS_DOWN). Comparison of genes differentially expressed in KPC-Ago2+/+ versus KPC-Ago2−/− organoids. NES, normalized enrichment score. (D, Left) Immunoblot analysis of protein lysates from KPC-Ago2+/+ versus KPC-Ago2−/− organoid-derived cells. Phosphorylated ERK (pERK), total ERK (tERK), and histone H3 (H3). (D, Right) Immunoblot analysis of KPC-Ago2−/− organoid-derived cells transfected with constructs encoding wild-type AGO2 (WT AGO2), AGO2K112A/E114A (K112A/E114A), and AGO2K98A (K98A).

