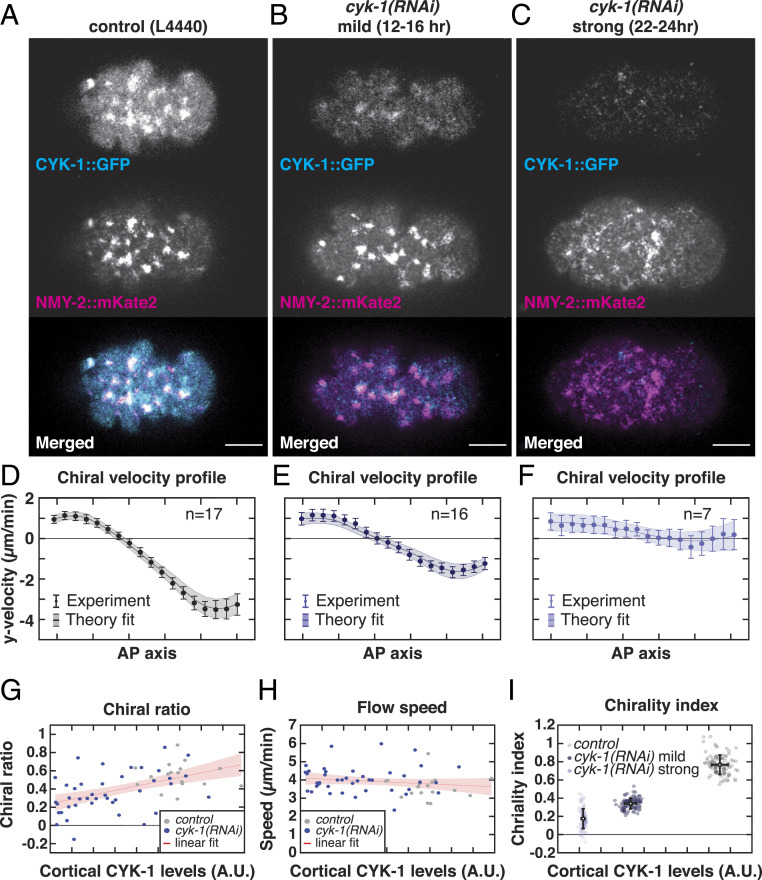
Fig. 2.
CYK-1/Formin promotes torque generation in the actomyosin cortex. (A–C) Representative micrographs of cortical CYK-1/Formin::GFP and NMY-2::mKate2 in (A) control (L4440), (B) mild cyk-1(RNAi) (12 to 16 h), and (C) strong cyk-1(RNAi) (22 to 24 h) during polarizing flows. (Scale bar, 10 m.) (D–F) Mean y-velocity profile in 18 bins along the anteroposterior axis. Conditions are as in A–C. Circles with error bars are the experimentally measured y velocities averaged over embryos, with SEM. Solid line shows the mean y velocities derived from fitting the hydrodynamic model to 100 bootstrap samples with replacement. Shaded region: standard deviation of the mean, derived from bootstrapping. n indicates the number of embryos. (G and H) Chiral ratio (G) and speed (H) of the cortical flow plotted over the measured cortical CYK-1/Formin::GFP fluorescence in control (L4440, gray) and upon increasing strength of cyk-1(RNAi) (blue). Data points represent individual embryos (control, n = 17; cyk-1(RNAi), n = 41). Red line with shaded region shows a linear fit with 95 confidence bounds. Chiral ratio, but not flow speed, correlates with cortical CYK-1/Formin::GFP (Spearman’s = 0.54, P 0.00002). (I) Chirality index plotted over the measured cortical CYK-1/Formin::GFP fluorescence in control (L4440, gray), mild cyk-1(RNAi) (12 to 16 h, dark blue), and strong cyk-1(RNAi) (22 to 24 h, light blue). Chirality index was obtained by fitting the hydrodynamic model to the mean of individual bootstrap samples with replacement. Simultaneously, in each bootstrap sample the mean cortical CYK-1/Formin::GFP fluorescence was calculated. Gray and blue data points represent individual bootstrap samples. Black points with error bars display the mean over all bootstrap samples with standard deviation.

