Fig. 3.
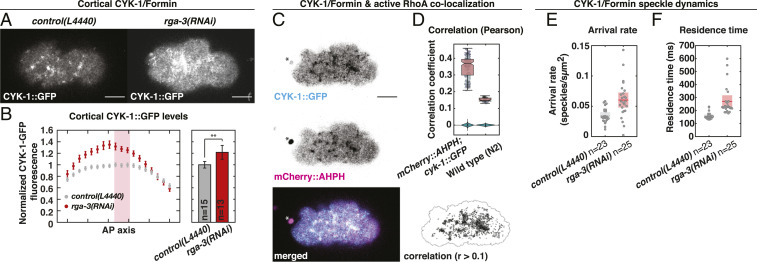
CYK-1/Formin is a RhoA target during polarizing flows. (A) Representative micrographs of cortical CYK-1/Formin::GFP in control (L4440, Left) and upon rga-3(RNAi) (Right). (B) Left, mean cortical CYK-1/Formin::GFP fluorescence in 18 bins along the anteroposterior axis in control (L4440, gray) and upon rga-3(RNAi) (red). Fluorescence levels were normalized to the mean levels in bins 9 to 11 (red rectangle). Error bars, SEM. Right, mean cortical CYK-1/Formin::GFP fluorescence measured in bins 9 to 11. Error bars, 95 confidence interval. Significance testing: **P 0.01 (Wilcoxon rank sum test). n indicates the number of embryos. (C) Cortical CYK-1/Formin::GFP (Top), mCherry::ANI-1(AHPH) (Middle), and merged (Bottom). Asterisk marks the polar body. (Bottom Right) Regions of colocalization in black (Pearson’s correlation coefficient 0.1). Black line: masked region. (D) Pearson’s correlation coefficient computed in cyk-1::GFP; mCherry::ani-1(AHPH) (n = 13 embryos) and N2 wild type (n = 4 embryos) to control for correlation of autofluorescence. Data points represent individual frames (15 frames per embryo), and box plot is overlaid. As a negative control the correlation was computed after scrambling the pixels in one channel, 100 times independently. Violin plots display the distribution of these negative controls. (E and F) CYK-1/Formin::GFP speckle arrival rate (E) and residence time (F) in control (L4440; gray, n = 23 embryos) and upon rga-3(RNAi) (red, n = 25 embryos). Data points represent individual embryos. Boxes indicate mean with 95 confidence interval. (Scale bars, 10 m.)

