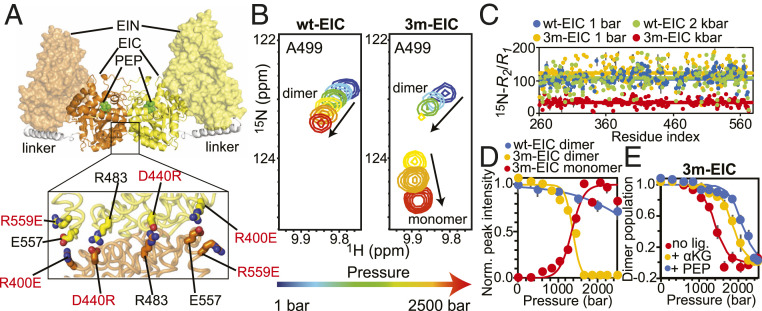
Fig. 1.
A folded EIC monomer at high pressure. (A) Solution structure of the full-length EI dimer. The two subunits are colored orange and yellow, respectively. The EIN and EIC domains are shown as transparent surface and solid cartoon, respectively. The helical linker is colored white. PEP modeled in the active site on EIC is shown as green spheres. In the lower panel, the three single-point mutations introduced at the dimer interface to engineer the 3m-EIC construct are highlighted. (B) Pressure titration for a representative 1H-15N NMR cross-peak that reports on the monomer/dimer equilibrium in wt-EIC (Left) and 3m-EIC (Right). The relationship between cross-peak color and pressure is given by the arrow below the spectra (i.e., blue: 1 bar; red: 2.5 kbar). (C) 15N-R2/R1 data measured for wt-EIC at 1 bar (blue), wt-EIC at 2 kbar (green), 3m-EIC at 1 bar (orange), and 3m-EIC at 2 kbar (red) are plotted versus the residue index. The average R2/R1 value of each construct is shown as a solid line. (D) Normalized signal intensities are averaged over all NMR cross-peaks displaying distinct signals for the monomer and dimer species during the pressure titration on 3m-EIC (i.e., B). The normalized averaged intensities for the wt-EIC dimer (blue circles), 3m-EIC dimer (orange circles), and 3m-EIC monomer (red circles) are plotted versus the external pressure (note that no NMR signal is observable for the wt-EIC monomer in the tested pressure range). The normalized averaged intensities were calculated using 54 peaks form the dimer interface. The error bars are set to 1 SD. The modeling of the data (SI Appendix, Supporting Materials and Methods) is shown as solid curves. Note that the dissociation of the 3m-EIC monomer at high pressure if fully reversible (SI Appendix, Figs. S3 and S4). (E) The fractional population of dimer obtained by pressure titration experiments on 3m-EIC in the absence of ligands (red circles) and in the presence of 20-mM α-KG (orange circles) or PEP (blue circles) is plotted versus the external pressure. The modeled curves (SI Appendix, Supporting Materials and Methods) are shown as solid lines.

