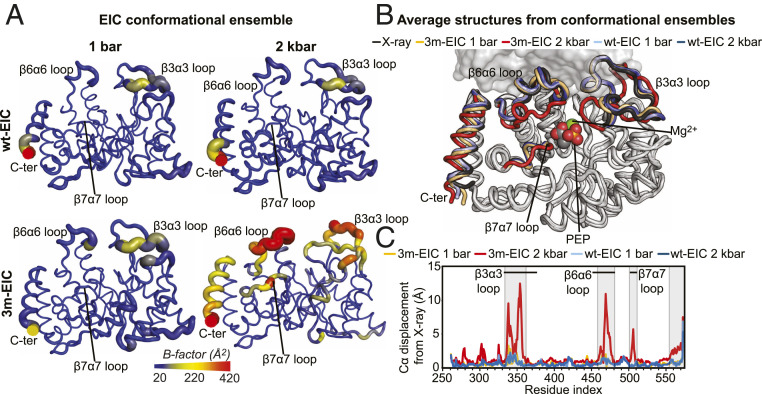
Fig. 2.
Monomerization affects the structure and dynamics of the EIC active site. (A) Sausage representation of the aMD/RDC conformational ensembles generated for wt-EIC at 1 bar (Top Left), wt-EIC at 2 kbar (Top Right), 3m-EIC at 1 bar (Bottom Left), and 3m-EIC and 2 kbar (Bottom Right). The cartoons are colored according to the B-factor, as indicated by the color bar. B-factors were calculated using the formula , where Bi and Ui are the B-factor and mean-square displacement of atom i, respectively. (B) The average structures from the conformational ensembles are superimposed on the crystal structure of wt-EIC. The ensembles were calculated for a single subunit of the EIC dimer (SI Appendix, Supporting Materials and Methods). The second subunit from the crystal structure is displayed as a transparent gray surface as a reference. PEP and Mg2+ (not used in the ensemble calculation) are shown as spheres in the EIC active site. The C-terminal helix and the α3β3, α6β6, and α7β7 loops are colored black, light blue, dark blue, orange, and red for the X-ray structure, wt-EIC at 1 bar, wt-EIC at 2 kbar, 3m-EIC at 1 bar, and 3m-EIC at 2 kbar, respectively. (C) The C-α displacement from the X-ray structure calculated for the average structure of wt-EIC at 1 bar (light blue), wt-EIC at 2 kbar (dark blue), 3m-EIC at 1 bar (orange), and 3m-EIC at 2 kbar (red) is plotted versus the residue index. The residues experiencing large C-α displacement upon monomerization are boxed. The location on the α3β3, α6β6, and α7β7 is indicated by black horizontal lines.

