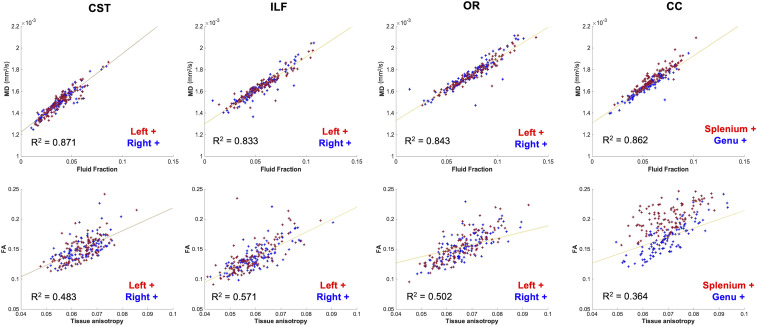
Fig. 4.
(Top row) partial correlations between tract-average MD and volume fraction of the fluid component (significant relationship for all partial correlations, P < 0.01). (Bottom row) Mean FA value of the tract plotted against the square root of the power in the l = 2 band of the tissue component (tissue anisotropy) values in voxels traversed by each tract (significant relationship for all partial correlations, P < 0.05).

