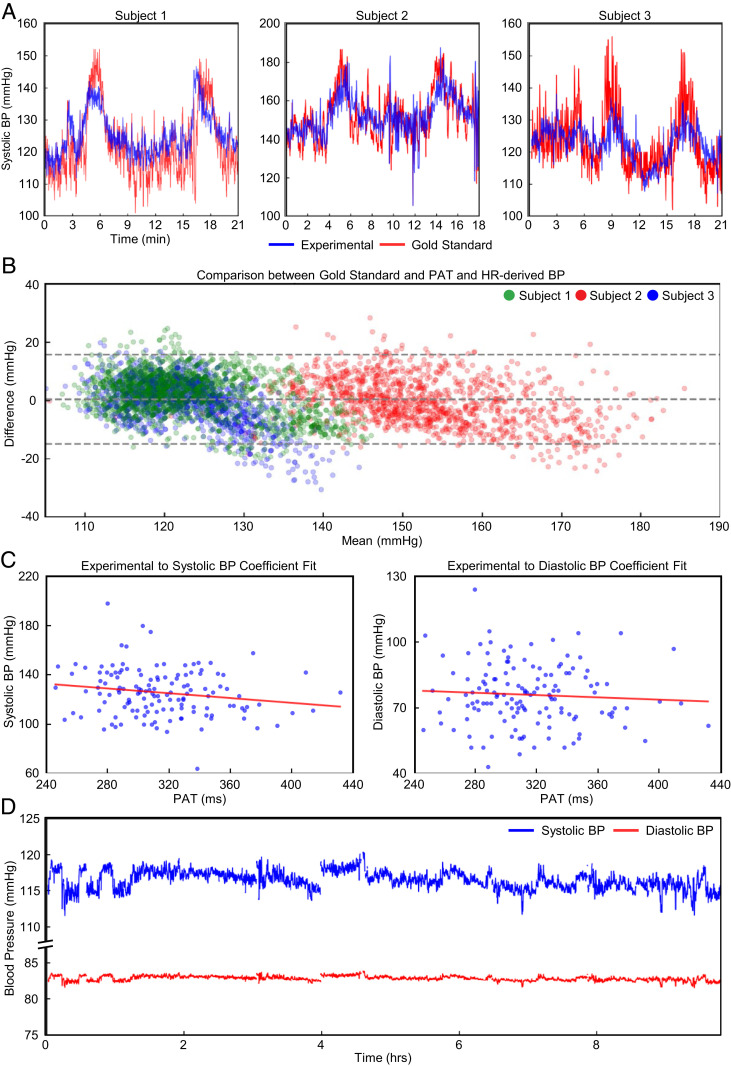
Fig. 4.
Continuous blood pressure correlation. The derivation of continuous BP from PAT and HR measurements. (A) In a cold-pressor test, we use the first 50 s of sampled data to derive linear coefficients for PAT. For each sample, we overlay the gold-standard SBP. (B) A Bland–Altman plot comparing the calibrated PAT to the gold-standard SBP from the cold-pressor test is presented. (C) An inverse relationship across all participants is derived between PAT and sampled BP cuff measurements. (D) n = 1 is shown for the converted systolic and diastolic BPs from PAT.

