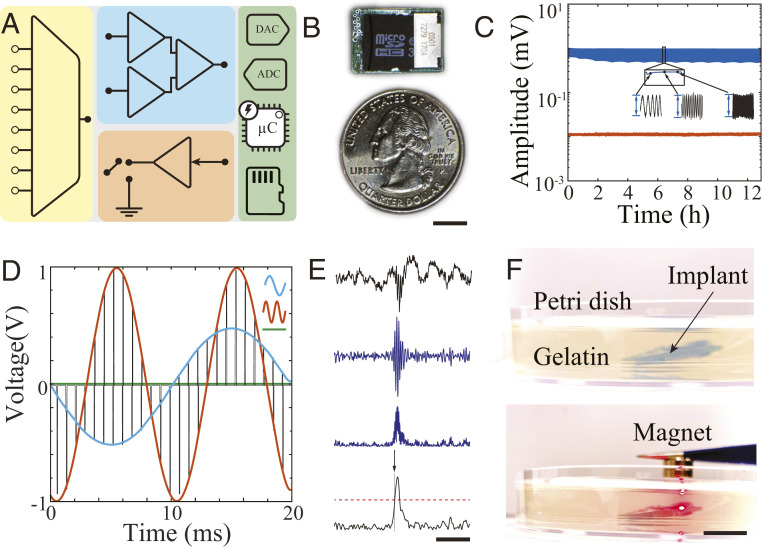
Fig. 2.
MTA-based recording, stimulation, and processing within an embedded neuroelectronic system. (A) Simplified schematic of an MTA-based embedded system consisting of a multiplexer (yellow), acquisition amplifier (blue), stimulation unit (orange), and digital controller containing analog/digital converters, processors, and data storage unit (green). (B) Optical image of MTA-based embedded neuroelectronic system next to a quarter. The board dimensions are 18 × 12.8 mm2 (Scale bar, 5 mm). (C) Long-term, continuous sweep signal (500 µV, 1 to 500 Hz) recording from two adjacent channels demonstrating consistent signal acquisition (blue trace) with minimum cross-talk on the adjacent channel (orange). See SI Appendix, Fig. S5A for experimental setup. (D) Simultaneous output voltage traces of stimulation unit delivering MTA-based multiplexed, multichannel stimulation patterns to two channels at different sine wave frequencies (orange channel = 100 Hz at 1 V; blue channel = 50 Hz at 0.5 V). Voltage of remaining channels (green trace) was unchanged. (E) Illustration of the real-time neural oscillation detection process. From top to bottom: 1) wideband LFP containing a ripple oscillation at the center; 2) ripple-band–filtered data; 3) rectified data; and 4) rectified trace smoothed by a moving average filter (black). The red dashed line shows 3× baseline mean value trigger level with arrow indicating the triggering onset (Scale bar, 200 ms). (F) Photograph of MTA device implanted in 10 mm of gelatin hydrogel to simulate implantation in tissue (Top). When a magnet is placed in the vicinity of the device, recording is initiated and red light-emitting diode indicator turns on (Bottom) (Scale bar, 10 mm).

