Fig. 3.
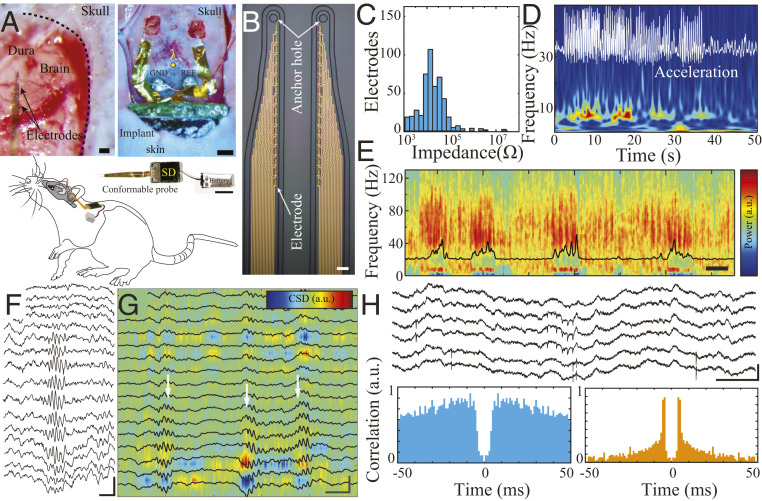
MTA-based fully implantable system enables high-resolution LFP and action potential recordings in freely moving rodents. (A) Optical micrograph of pial surface of rat brain and conformable implantable probes prior to insertion (Top Left [Scale bar, 50 µm]). An optical micrograph of the MTA device partially implanted into the subcutaneous space, while conformable implantable probes are placed on top of bilateral craniotomies (Top Right [Scale bar, 1 mm]). Complete neural-embedded system with conformable probe and battery prior to implantation (Middle; note the device does not have any encapsulation for better visualization [Scale bar, 10 mm]). A simplified schematic of the overall placement and location of the implant in a rat (Lower). (B) Optical micrograph of the microfabricated conducting polymer–based electrode array (Scale bar, 20 μm). (C) Histogram of the impedance of the fabricated microelectrodes (n = 480, 4.41 ± 0.6 kΩ). (D) Spectrogram of hippocampal area CA1 LFP recorded during locomotion. The white superimposed trace shows the motion pattern acquired by the LFP-synchronized onboard 3-axis accelerometer. (E) Spectrogram of hippocampal area CA1 LFP recorded during a sleep session after 1 wk of implantation. Black trace: theta/delta band power ratio (Scale bar, 500 s). (F) Sample LFP traces from a linear probe illustrating the depth profile of a hippocampal ripple (Scale bar, 50 ms, 500 µV). (G) Current source density (CSD) and superimposed corresponding LFP traces from hippocampal area CA1 highlighting the presence of localized sources and sinks in MTA-based recordings. The white arrows indicate ripple epochs (Scale bar, 50 ms, 500 µV). (H) Action potentials recorded by the MTA device. Sample wide-band traces showing action potentials (Upper; [Scale bar, 50 ms, 500 µV]). Sample autocorrelograms of the putative single units (Lower).

