Fig. 6.
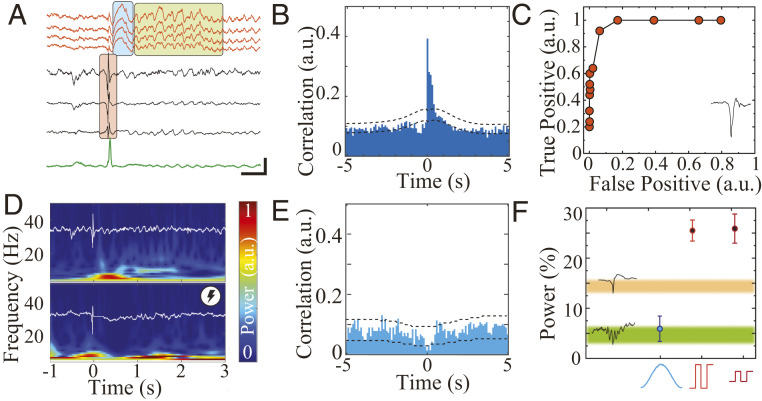
Real-time, closed-loop suppression of pathological hippocampal–cortical coupling by MTA-based embedded system. (A) Wideband LFP showing IED (red box) in hippocampal traces (black) coupled with a delta wave (blue box) and a sleep spindle (green box) in mPFC traces (orange) during NREM sleep. The green trace is output of digital signal processor for IED detection (Scale bar, 100 ms, 500 µV). (B) Cross-correlogram of hippocampal IEDs and mPFC spindles. Dashed line = 95% CI (n = 4, sessions = 21, IEDs = 6,342, spindles = 6,319). (C) Receiver operating characteristics curve for the online IED detector compared to the offline detector (n = 1, sessions = 1, IEDs = 4,859). (D) Sample time-frequency spectrograms of IED-triggered responses in mPFC without closed-loop control (Upper) and with effective closed-loop spindle suppression protocol (Lower). The overlaid white traces show corresponding hippocampal LFP. (E) Cross-correlogram of hippocampal IEDs and mPFC spindles with Gaussian-based closed-loop spindle suppression protocol. Dashed line = 95% CI (4 animals, 21 sessions, n = 6,342). (F) Summary of power changes in spindle band with closed-loop Gaussian stimulation (n = 1,492 from four animals, 13 sessions, 0.059 ± 0.5), closed-loop high-amplitude pulse stimulation (n = 2,897 from four animals, six sessions, 0.26 ± 0.58), low-amplitude stimulation (n = 1,305 from four animals, six sessions, 0.26 ± 0.53). Mean and 95% CI are plotted for each group; Kolmogorov–Smirnov test P = 0.00024). The 95% CI for spindle band power after IED (orange, n = 6,342 from four animals, 21 sessions, 0.14 ± 0.51) and after ripple in nonkindled animal (green, n = 2,266 from three animals, six sessions, 0.048 ± 0.39) are plotted as color shaded areas.

