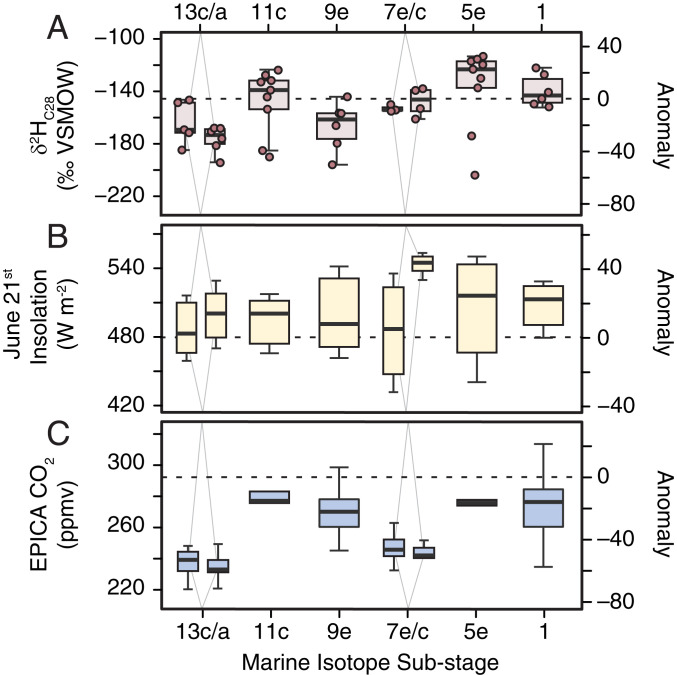
Fig. 4.
Climate forcings and southern Greenland response during peak Marine Isotope substages. Both substages were included for MIS13 and MIS7, when peak substages are poorly defined. Comparison of δ2HC28 (A), 65°N insolation (B) (6), and CO2 (C) (7) between peak Marine Isotope substages. Boxplots represent distribution of values within the substage. Dashed lines indicate the mean for 1 to 0 ka, and right axes present values as anomalies relative to this mean.

