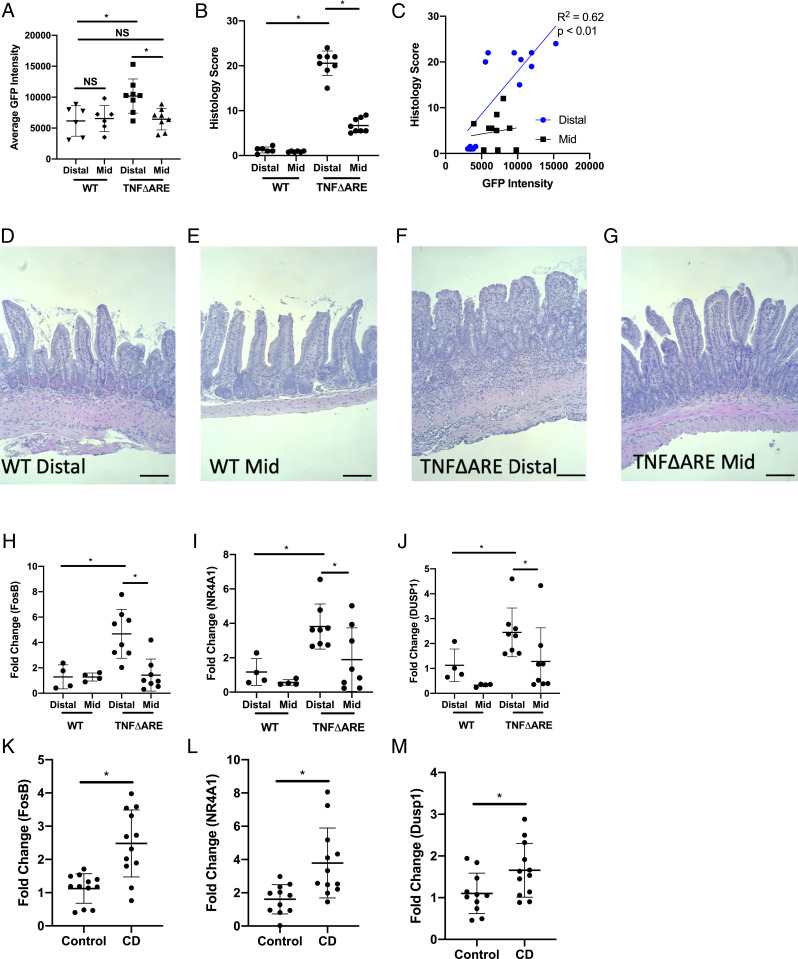
Fig. 4.
Expression of acidosis-associated genes in inflamed tissue. (A) Flow cytometry analysis of sfGFP intensity in pH reporter E. coli isolated from the mid- and distal ileum of WT and TNFΔARE mice (n = 6 and n = 8 for WT and TNFΔARE mice, respectively). (B) Histological scoring for the mid- and distal ileum collected from WT and TNFΔARE mice (n = 6 and n = 8 for WT and TNFΔARE mice, respectively). (C) Correlation plot between histological score bacterial sfGFP intensity for both the mid- and distal ileum (n = 6 and n = 8 for WT and TNFΔARE mice, respectively). (D–G) Representative histology images for the distal and mid-ileum from WT (D and E) and TNFΔARE (F and G) mice. Black scale bar represents 50 μm. (H–J) Transcript expression of FosB (H), NR4A1 (I), and DUSP1 (J) in the mid- and distal ileum of WT and TNFΔARE mice (n = 4 and n = 8 for WT and TNFΔARE mice, respectively). (K–M) Transcript expression of FosB (K), NR4A1 (L), and DUSP1 (M) in tissue collected from the ileum and colon of healthy controls and CD patients (n = 12). Data from each experiment was pooled and expressed as mean ± SD and the P value determined by t test or ANOVA, *P < 0.01.

