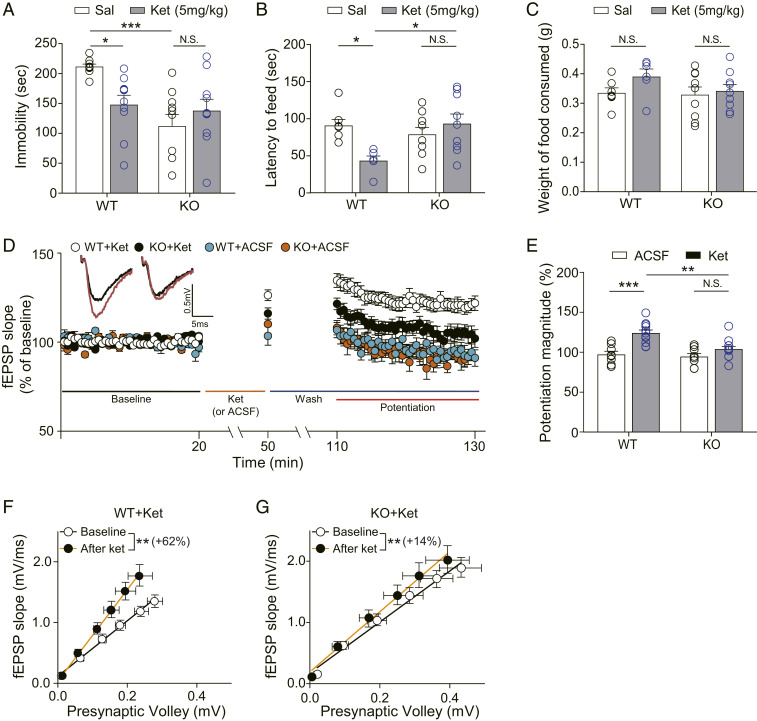
Fig. 2.
Ketamine does not produce antidepressant-like behavioral changes and synaptic potentiation in Apoer2 KO mice. (A) Accumulated time mice spent immobile during the FST performed 2 h after ketamine injection. Ketamine significantly decreased immobility in WT mice. Apoer2 KO mice showed reduced immobility, compared with vehicle-treated WT mice. Ketamine did not further reduce the immobility in Apoer2 KO mice [two-way ANOVA with Tukey’s multiple comparisons, Genotype × Drug: F(1, 35) = 7.535, P = 0.0095, Genotype: F(1, 35) = 11.36, P = 0.0018, Drug: F(1, 35) = 1.362, P = 0.2511, n = 9 to 10 mice per group]. (B) NSFT. Latency to feed was measured 2 h after ketamine i.p. injection. Ketamine significantly reduced latency to feed in WT mice but not in Apoer2 KO mice [two-way ANOVA with Tukey’s multiple comparisons, Genotype × Drug: F(1, 27) = 8.509, P = 0.0070, Genotype: F(1, 27) = 3.194, P = 0.0851, Drug: F(1, 27) = 2.413, P = 0.1319, n = 6 to 9 per group]. (C) A bar graph that represents the amount of consumed food. Immediately after the NSFT, the mouse was transferred to the home cage and the amount of food consumed for 5 min was measured. No statistical significance was observed in any comparisons between groups [two-way ANOVA with Tukey’s multiple comparisons, Genotype × Drug: F(1, 27) = 0.803, P = 0.3782, Genotype: F(1, 27) = 1.352, P = 0.2551, Drug: F(1, 27) = 2.087, P = 0.1591, n = 6 to 9 per group]. (D) Ketamine potentiation was measured after 20 min of baseline measurement, 30 min of ketamine perfusion, and 1 h of washout period in the hippocampal CA1 region. All responses were normalized to respective baselines. (Inset) Representative waveforms during baseline (black) or ketamine potentiation (red) measurement. (E) A bar graph that summarizes the magnitude of ketamine potentiation of respective groups measured in D. Significantly increased potentiation magnitude by ketamine was observed in WT mice but not in KO mice [two-way ANOVA with Tukey’s multiple comparisons, Genotype × Drug: F(1, 36) = 5.181, P = 0.0289, Genotype: F(1, 36) = 8.669, P = 0.0056, Drug: F(1, 36) = 21.62, P < 0.0001, n = 8 to 12 per group]. (F and G) I–O curves measured during baseline and potentiation measurement in D. Initial slopes of fEPSPs versus presynaptic volley values are plotted at 4, 8, 12, 16, 20, and 24 μA stimulation intensity. The slope of the I–O curve was significantly increased after ketamine treatment in both the WT slices and the KO slices [paired t test, WT+Ket (F): t(9) = 3.334, P = 0.0087, n = 10; KO+Ket (G): t(10) = 3.709, P = 0.004, n = 11]. However, the increase rate of the slope by ketamine perfusion was 62% in the WT+Ket group but only 14% in the KO+Ket group. All data represented as mean ± SEM; *P < 0.05, **P < 0.01, and ***P < 0.001.

