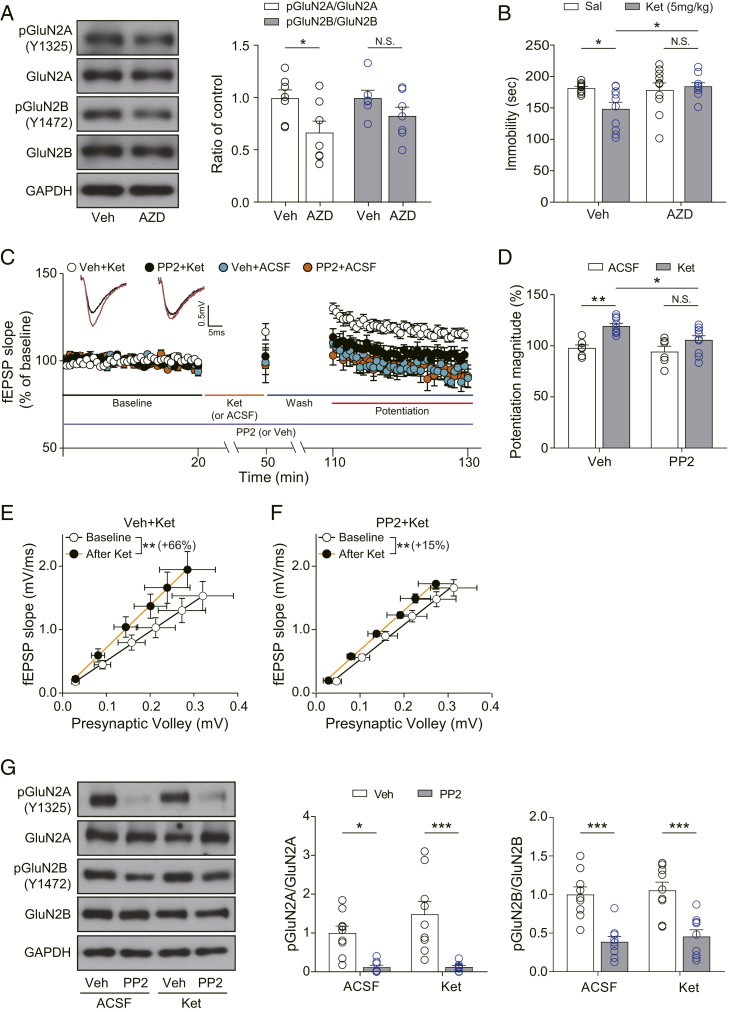
Fig. 3.
SFKs inhibition abolishes ketamine-mediated behavioral changes and synaptic potentiation. (A) Western blots and quantification showing GluN2A phosphorylation but not GluN2B phosphorylation was significantly decreased by AZD treatment [unpaired t test, pGluN2A/GluN2A: t(12) = 2.423, P = 0.0322; pGluN2B/GluN2B: t(11) = 1.459, P = 0.1727, n = 6 to 7 per group]. (B) Accumulated time the mice spent immobile during the FST performed 2 h after ketamine injection. AZD was injected 30 min before the ketamine injection. Pretreatment of AZD prevented the significant reduction of immobility by ketamine [two-way ANOVA with Tukey’s multiple comparisons, AZD × ketamine: F(1, 35) = 5.285, P = 0.0276, AZD: F(1, 35) = 3.740, P = 0.0613, ketamine: F(1, 35) = 2.514, P = 0.1218, n = 9 to 10 per group]. (C) Ketamine potentiation was measured after 20 min of baseline measurement, 30 min of ketamine perfusion, and 1 h of washout period in the hippocampal CA1 region. PP2 was applied for the whole duration of the experiment. All responses were normalized to respective baselines. (Inset) Representative waveforms during baseline (black) or ketamine potentiation (red) measurement. (D) A bar graph that summarizes the magnitudes of ketamine potentiation of respective groups measured in C. PP2 prevented the significant increase of potentiation magnitude induced by ketamine [two-way ANOVA with Tukey’s multiple comparisons, PP2 × ketamine: F(1, 28) = 1.706, P = 0.2021, PP2: F(1, 28) = 5.095, P = 0.0320, ketamine: F(1, 28) = 18.51, P = 0.0002, n = 6 to 10 per group]. (E and F) I–O curves measured during baseline and potentiation measurement in C. Initial slopes of fEPSPs versus presynaptic volley values are plotted at 4, 8, 12, 16, 20, and 24 μA stimulation intensity. The slope of the I–O curve was significantly increased after ketamine treatment in both the vehicle-treated slices and the PP2-treated slices [Wilcoxon matched-pairs signed rank test, DMSO+Ket (E): P = 0.0039, n = 9; PP2+Ket (F): P = 0.0117, n = 9]. However, the increase rate of the slope following ketamine perfusion was 66% in the Veh+Ket group but reduced to 15% in the PP2+Ket group. (G) Western blots and quantification of GluN2A, GluN2B, and their respective phosphorylation forms. Samples were collected after completion of recording in C. GluN2A and GluN2B phosphorylation were significantly decreased by PP2 treatment regardless of ketamine treatment, confirming the pharmacological effects of PP2 [two-way ANOVA with Tukey’s multiple comparisons, pGluN2A/GluN2A—PP2 × ketamine: F(1, 30) = 1.373, P = 0.2505, PP2: F(1, 30) = 30.32, P < 0.0001, ketamine: F(1, 30) = 1.452, P = 0.2376, pGluN2B/GluN2B—PP2 × ketamine: F(1, 32) = 0.0051, P = 0.9431, PP2: F(1, 32) = 43.67, P < 0.0001, ketamine: F(1, 32) = 0.4409, P = 0.5114, n = 8 to 9 per group]. All data represented as mean ± SEM; *P < 0.05, **P < 0.01, and ***P < 0.001.

