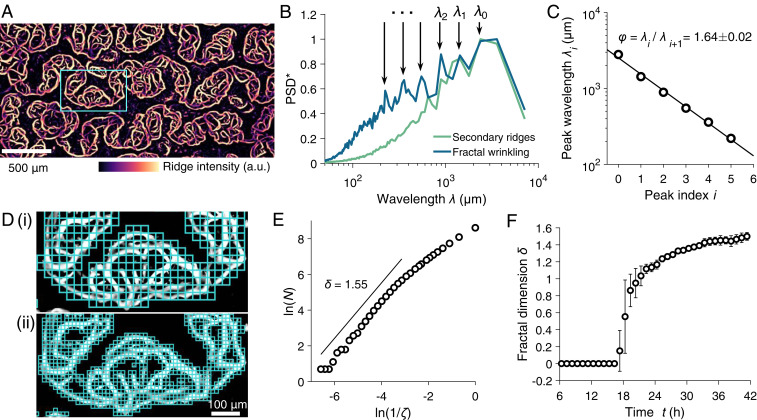
Fig. 3.
V. cholerae pellicle maturation exhibits the emergence of features with progressively smaller wavelengths and development of fractal wrinkles. (A) Fractal wrinkling of the V. cholerae pellicle as measured by ridge intensities at an inoculum seeding density of OD600 = 0.01. (B) Normalized power spectral density (PSD*) of ridge intensities in the direction orthogonal to the primary wrinkling for both Stage II secondary ridges (green) and Stage III fractal wrinkling (blue). The discrete spectral peaks that occur at progressively smaller wavelengths are labeled λi with i = 0, 1, and 2. (C) The spectral peak wavelengths from B as a function of peak index i. The ratio of consecutive peak wavelengths is denoted φ. (D) The fractal morphology of the pellicle measured using a box-counting scheme at increasingly finer length scales ζ, in i and ii, respectively. The skeletonized pellicle ridge intensities in the highlighted box in A were used. (E) The Hausdorff dimension δ = 1.55 due to the wrinkled pellicle morphology was extracted from the scaling of box count N versus box length scale ζ for the images shown in D. (F) The time evolution of the fractal dimension δ through the complete V. cholerae pellicle morphogenesis transition (Stages 0 through III).

