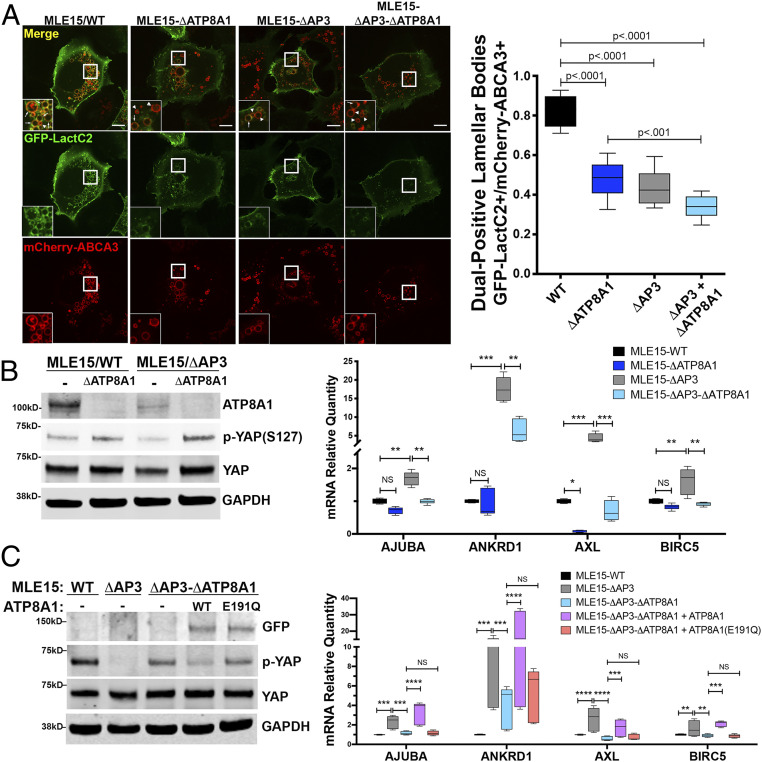
Fig. 7.
Mistargeting of ATP8A1 in the absence of AP-3 activates YAP. (A) Representative images captured from live-cell imaging of MLE15/WT, MLE15/ΔAP3, MLE15/ΔATP8A1, and MLE15/ΔAP3-ΔATP8A1 cells expressing mCherry-ABCA3 and the biosensor GFP-LactC2 (arrow: GFP-LactC2+/mCherry-ABCA3+ dual-positive LBs; arrowhead: mCherry-ABCA3+/GFP-LactC2- LBs). Live-cell imaging was obtained using identical microscope settings, and still images were derived from the first frame to avoid photobleaching. GFP-LactC2/mCherry-ABCA3 dual-positive organelles as a fraction of total mCherry-ABCA3-positive organelles (n = 2; 10 cells; box and whiskers plot showing minimum, 25th percentile, median, 75th percentile, and maximum). (Scale bar, 10 μm.) (B) ATP8A1-dependency of YAP signaling in MLE15 cells described in A. (Left) Composite representative IB (n = 3; 15 μg cell lysate per lane) for endogenous ATP8A1, phospho-YAP-Ser127, total YAP, and GAPDH. (Right) RT-qPCR for Ajuba, Ankrd1, Axl, Birc5 RNA (n = 3; box and whiskers plot as described in A; *P < 0.05, **P < 0.01, ***P < 0.001, ****P < 0.0001). (C) Flippase-dependency of YAP signaling in MLE15/ΔAP3 cells. (Left) Composite representative IB of MLE15/WT and MLE15/ΔAP3cells, and MLE15/ΔAP3-ΔATP8A1 cells expressing GFP, GFP-ATP8A1, or GFP-ATP8A1(E191Q) (n = 3; 15 μg cell lysate per lane) for GFP, p-YAP-Ser127, total YAP, and GAPDH. (Right) RT-qPCR for Ajuba, Ankrd1, Axl, Birc5 RNA (n = 3; box and whiskers plot and P values as described in B).

