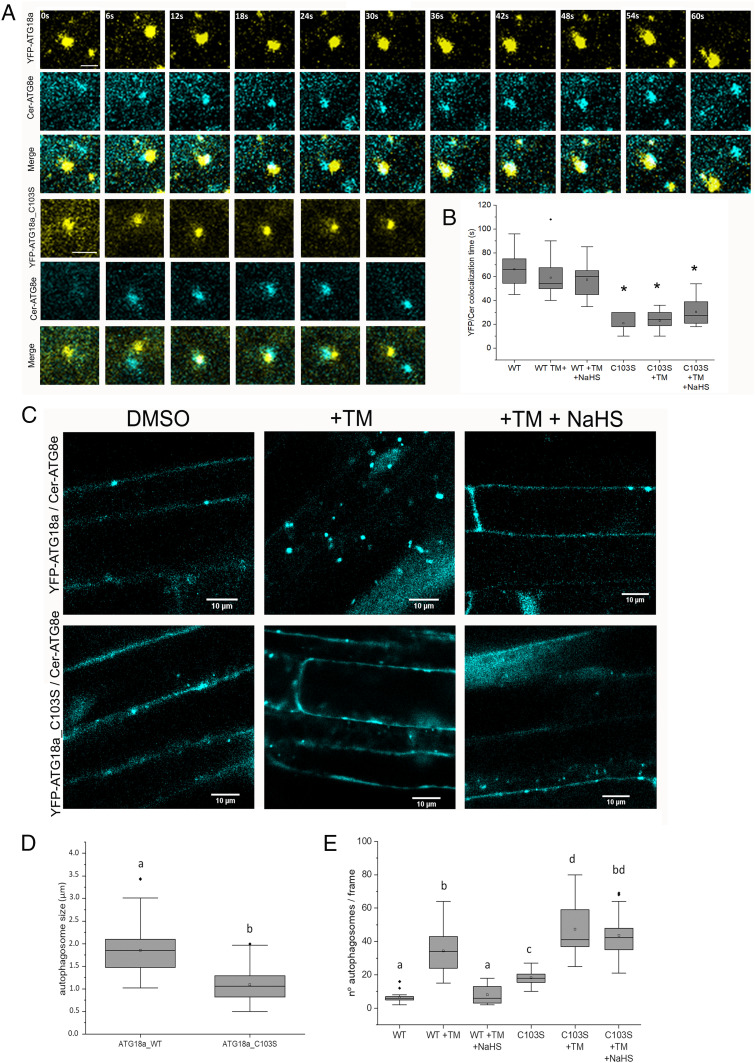
Fig. 5.
Time-lapse confocal fluorescence microscopy of autophagosomes in roots from 1-wk-old seedlings treated with TM and sulfide (NaHS). (A) Confocal images for colocalization of YFP-ATG18a and YFP-ATG18a_C103S with Cer-ATG8e. (Scale bars, 2 μm.) (B) Analysis of YFP/Cerulean colocalization time. The duration of colocalization is represented in seconds. (n > 15). (C) Confocal images for Cer-ATG8e in the double transgenic plants YFP-ATG18a/Cer-ATG8e and YFP-ATG18a_C103S/Cer-ATG8e after treatment with TM and NaHS. (D) Autophagosome size analysis measured with ImageJ, n = 200. (E) Autophagosome number quantification counted manually with ImageJ, n = 15. Values are the mean ± SD. Different letters indicate statistically significant differences (ANOVA, Fisher’s least significant difference test, P < 0.05).

