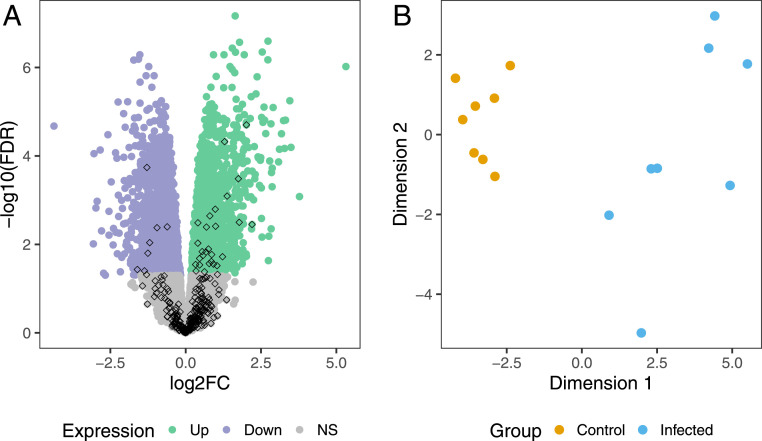
Fig. 4.
Differentially expressed nonreference genes. (A) A volcano plot representing results from the differential expression analysis. The green and purple color indicates genes that are up- and down-regulated (FDR ≤ 0.05), respectively, in peripheral blood leukocytes of M. bovis–infected cattle. The diamond shapes indicate the 272 genes found in nonreference sequences. (B) Multidimensional scaling plot of 36 differentially expressed nonreference genes in M. bovis–infected (blue) and noninfected (orange) Holstein cattle.

