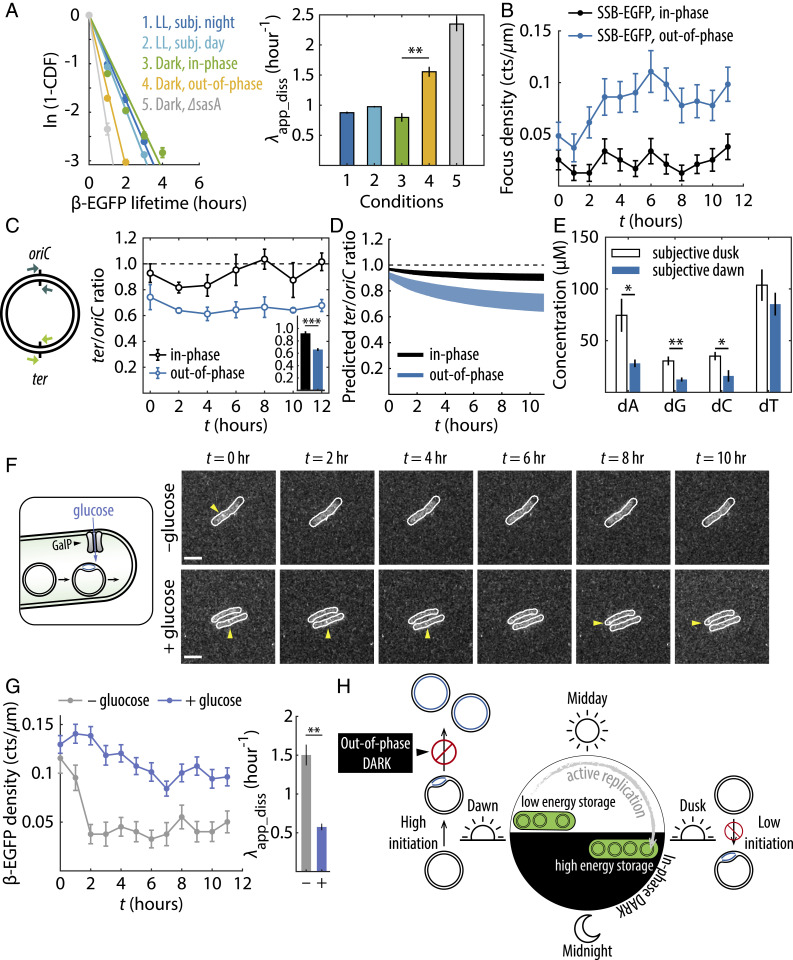
Fig. 4.
Incorrect clock state causes ongoing replication events to abort in the dark. (A, Left) log-survival functions of β-EGFP foci lifetime under various conditions. Solid lines are linear fits through the origin, the negative slopes of which correspond to the apparent dissociation rate constants (Right). Error bars are SEMs bootstrapped from over 2,000 foci trajectories from two to three independent experiments. **P < 0.01 (two-sample t test). (B) SSB-EGFP density time trace in the dark. Error bars are SEMs from two independent experiments. (C) qPCR quantification of ter/oriC ratios in the dark. Error bars are SEMs from four independent experiments. Inset shows ter/oriC ratios averaged throughout the night. ***P < 0.001. (D) Model-predicted ter/oriC ratios assuming 3 to 6 chromosomes per cell (21). (E) dNTP concentrations at subjective dawn and subjective dusk. Error bars are SEMs from four independent experiments. *P < 0.05, **P < 0.01. (F) Fluorescence images showing β-EGFP foci in GalP-expressing cells subject to an out-of-phase dark pulse, without (−) or with (+) glucose supplement. (G) β-EGFP density and apparent dissociation rate constants for GalP-expressing cells. Error bars are SEMs from two (−glucose) or three (+glucose) experiments. (H) Schematic diagram summarizing main findings of this study.

