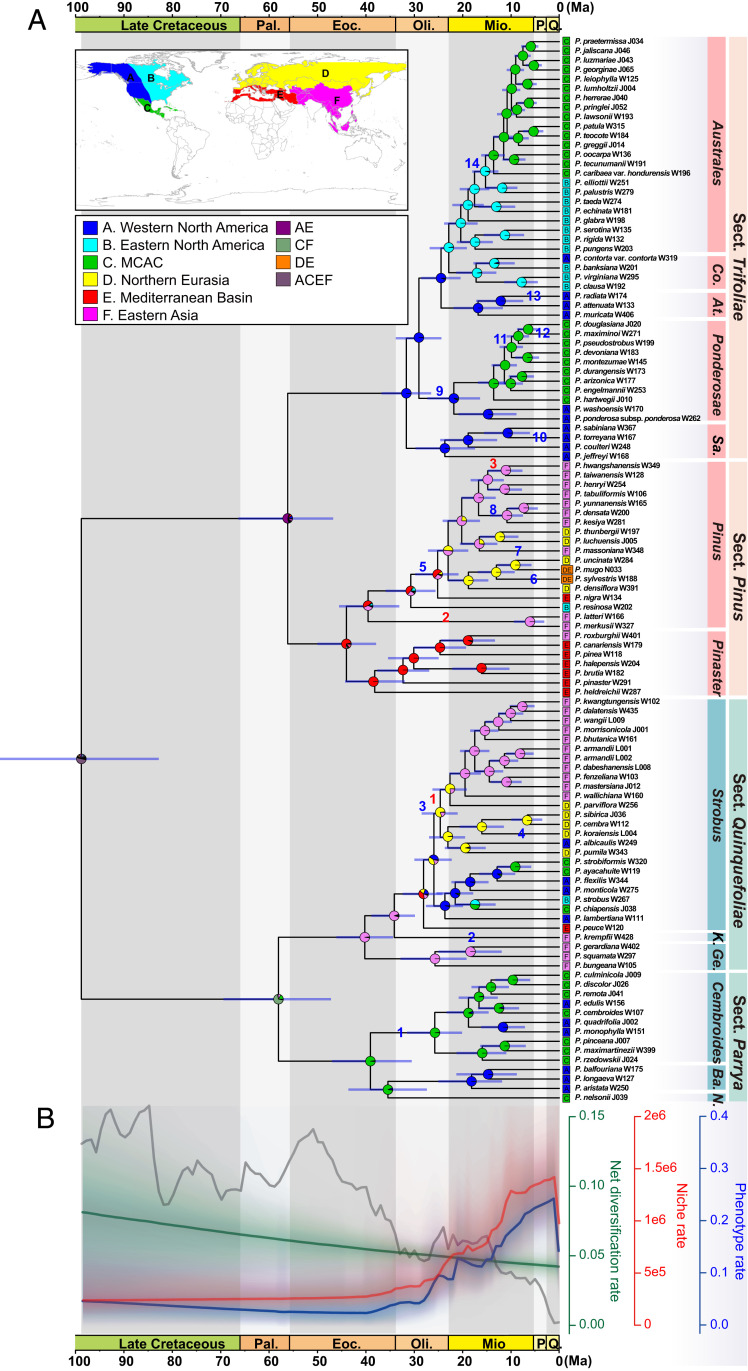
Fig. 2.
Historical biogeography of Pinus. (A) Ancestral range estimation using BioGeoBEARS with the DIVALIKE+J model. Divergence times were estimated using MCMCTree based on the concatenated CDS dataset (SI Appendix, Fig. S5). Horizontal bars at nodes indicate 95% credible intervals of the divergence time estimates. Pie charts at the nodes indicate relative probabilities of all possible geographic ranges. (B) Net diversification rate (green) and evolutionary rates of niche (red) and phenotypic traits (blue) estimated by BAMM, with color density shading to denote confidence on evolutionary rates through time. The unit of net diversification is species/Ma, and niche and phenotypic rates are unitless. Red numbers along branches represent major ecological niche shifts, and blue numbers along branches represent major phenotype shifts. The gray curve in the background shows the fluctuation of global temperature using the dataset from (94). Co., Contortae; At., Attenuatae; Sa., Sabinianae; K., Krempfianae; Ge., Gerardianae; Ba., Balfourianae; N., Nelsoniae; Pal., Paleocene; Eoc., Eocene; Oli., Oligocene; Mio., Miocene; P., Pliocene; Q., Quaternary; and MCAC represents Mexico, Central America, and Caribbean.

