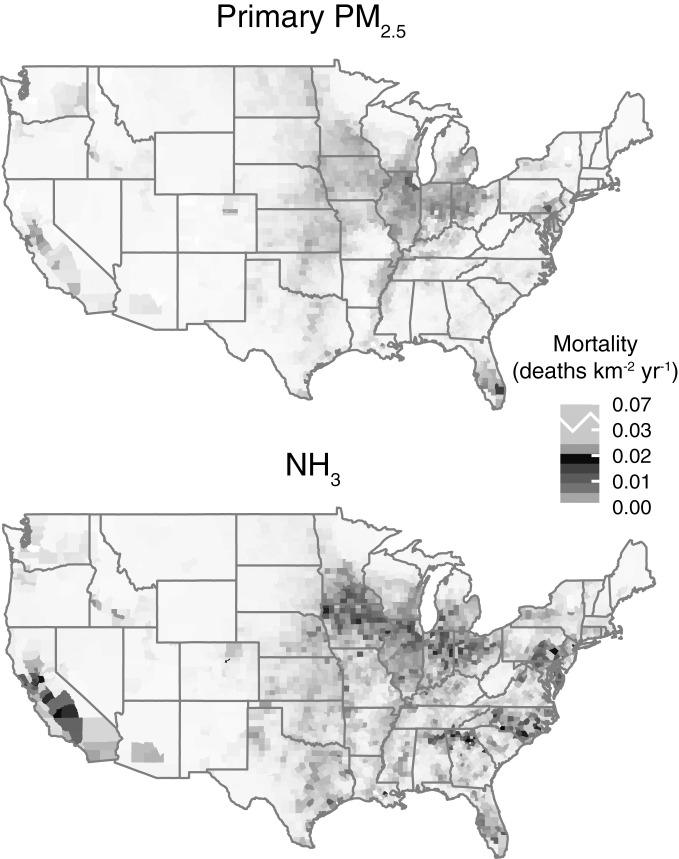
Fig. 2.
Spatial distribution of PM2.5-related mortality attributed to US agricultural production. Shown are annual premature deaths per square kilometer attributed to primary PM2.5 (Top) and secondary PM2.5 from NH3 (Bottom), which together comprise 97% of agricultural PM2.5-related deaths. Maps for the other 3% of deaths (i.e., from NOx, NMVOCs, and SO2) are shown in SI Appendix, Fig. S4. For each county, the mortality shown is that which occurs somewhere in the United States as a result of emissions from that county; that is, these maps show where the impact originates, not necessarily where it is experienced.

